المحتويات
مقال
Why Bitcoin’s latest drop points to a shift in market control
February 4, 2026
مقال
Why Bitcoin’s latest drop points to a shift in market control
February 4, 2026
مقال
Why Bitcoin’s latest drop points to a shift in market control
February 4, 2026

Bitcoin’s latest pullback is about more than price weakness - it highlights a changing balance of power in the market. The largest cryptocurrency has now fallen more than 40% from its October peak above $126,000 and briefly dipped below $73,000 this week, marking its lowest level since November 2024. The speed and depth of the decline suggest a clear loss of upside momentum.
More importantly, bitcoin has slipped below its True Market Mean Price, a valuation level that analysts often associate with transitions from buyer-led conditions to seller-driven phases. This move comes as investors scale back risk exposure amid turbulence in equity markets and renewed geopolitical uncertainty. With gold jumping almost 7% in a single session and volatility rising across asset classes, bitcoin’s price action increasingly reflects a shift in control away from buyers - one that may shape market behaviour well beyond the short term.
What’s driving Bitcoin’s latest drop?
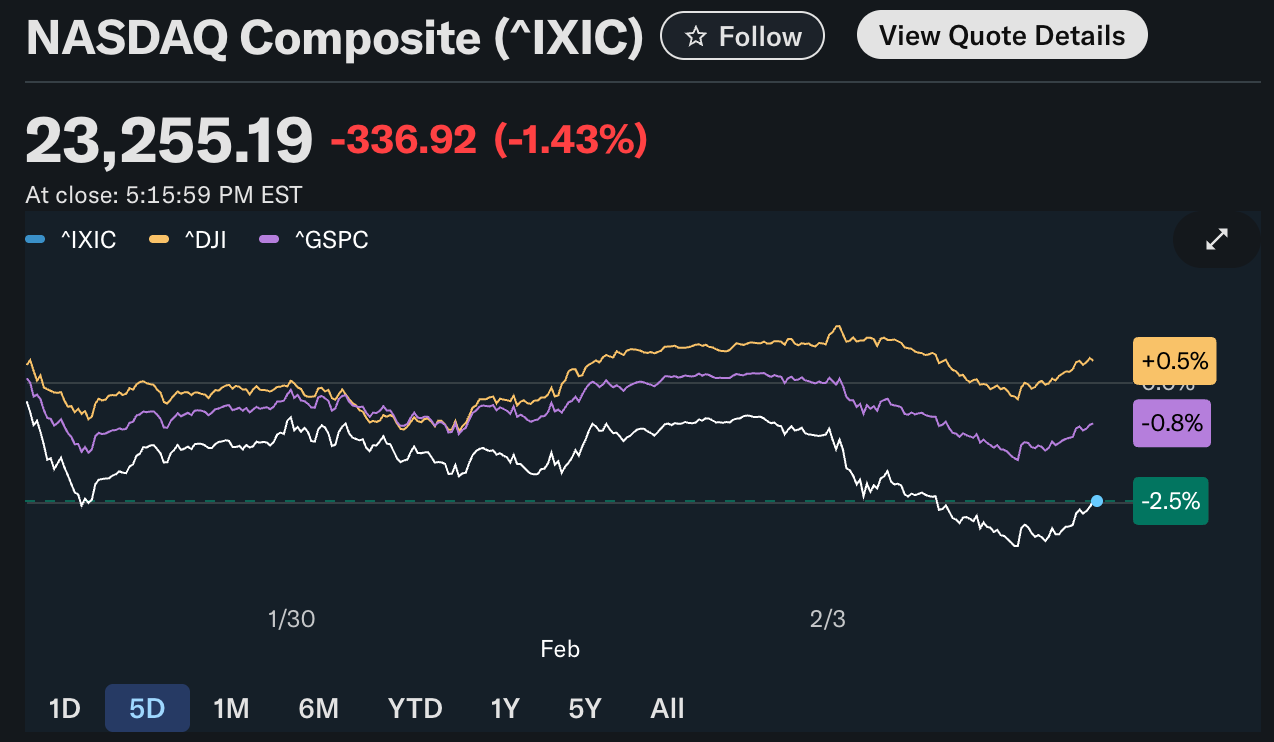
Bitcoin’s weakness has unfolded alongside a broader retreat from risk across global markets. US equities moved lower as confidence in the artificial intelligence trade softened, with the Nasdaq sliding 1.4% and technology shares leading losses.
Concerns intensified after slower-than-expected cloud growth at Microsoft, combined with rising AI-related investment costs, prompted investors to question whether technology valuations had become stretched. That reassessment weighed heavily on sentiment across growth-focused assets.
As equity markets pulled back, bitcoin moved in tandem with high-beta technology stocks rather than offering diversification. The cryptocurrency remained highly sensitive to liquidity conditions, with selling pressure accelerating as investors trimmed exposure. This dynamic is often amplified when positioning remains crowded, increasing the likelihood of sharp moves during periods of stress.
Geopolitical headlines added another layer of uncertainty. Reports that the US shot down an Iranian drone near a US aircraft carrier pushed the VIX volatility index briefly above 20, signalling heightened market anxiety.
Capital quickly flowed into traditional defensive assets, with gold and silver posting strong gains over the week, leaving bitcoin sidelined as investors prioritised capital preservation.
Why it matters: A break below the true market mean
The most telling signal from the recent move is bitcoin’s drop below its True Market Mean Price, currently estimated near $80,000.
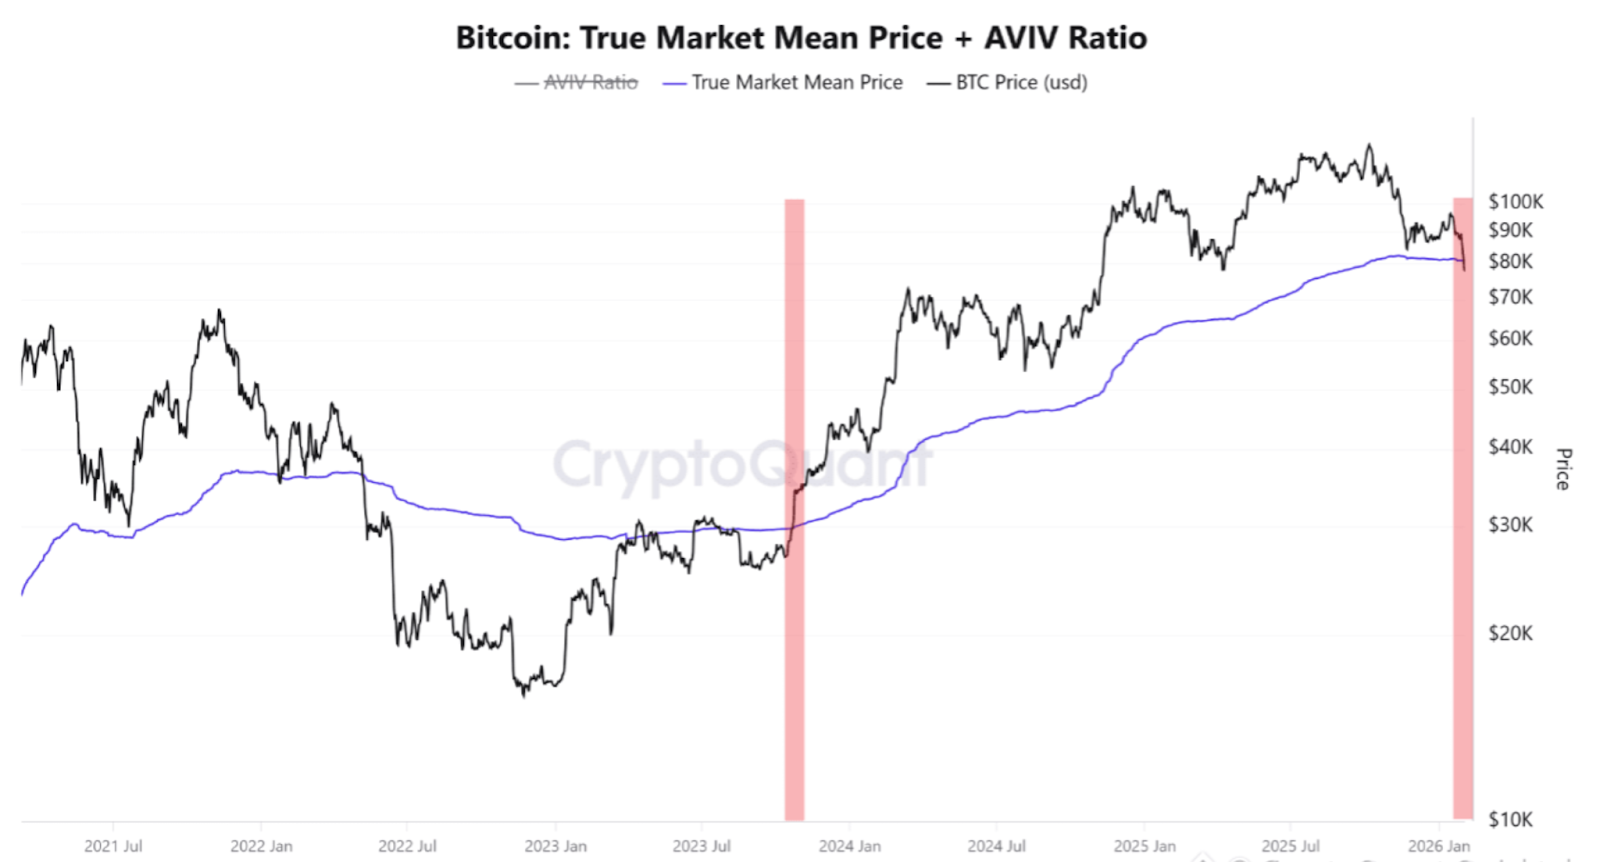
This metric captures the average historical cost basis of all bitcoin holders and is often used to gauge whether the broader market is sitting in profit or loss. When prices remain above this level, buyers tend to maintain control. When prices fall below it, selling pressure usually becomes more persistent as sentiment weakens.
Past cycles underline its importance. During the 2022 downturn, bitcoin’s weekly close below the same threshold preceded a prolonged decline lasting several months. While the current backdrop differs, investor behaviour often follows familiar patterns, with rallies attracting selling rather than fresh demand when large portions of the market are underwater.
Gerry O’Shea, head of global market insights at Hashdex, noted that bitcoin’s widening gap with gold reflects how investors currently assess risk. Gold has outperformed bitcoin over the past five years, reinforcing its role as a preferred store of value during periods of macro uncertainty. That preference shift is central to understanding who currently holds pricing power.
Impact on crypto markets and investors
The effects of the sell-off have been felt across the broader crypto market. Bitcoin’s sharp intraday move triggered liquidations, accelerating downside pressure and dragging major altcoins lower. When sellers dominate, price swings tend to become more pronounced as liquidity thins and confidence fades.
For retail investors, the impact is more gradual but no less significant. Many entered the market during the late-2024 rally, meaning a rising share of holders are now sitting on unrealised losses. Historically, this dampens risk appetite and slows recoveries, as investors become more cautious about re-entering. Institutional participation has also become more selective, with capital gravitating towards commodities and defensive assets rather than digital currencies.
Expert outlook: What happens next
Looking ahead, analysts expect bitcoin to remain volatile as the market seeks a new equilibrium. Regulatory uncertainty, fragile macro conditions, and tighter financial environments reduce the likelihood of a swift rebound. O’Shea expects near-term instability to persist as crypto continues to integrate into traditional financial systems, even though longer-term adoption trends remain intact.
Historically, breaks below key valuation levels tend to lead to extended periods of consolidation rather than immediate recoveries. Markets often require time for excess leverage to unwind and for stronger hands to absorb supply. Over the next three to six months, bitcoin’s ability to reclaim the $80,000 level will be closely monitored as a signal of whether buyers can regain control or whether sellers continue to dictate price action.
Key takeaway
Bitcoin’s latest decline signals more than short-term volatility - it points to a meaningful shift in market control. As global risk appetite fades, bitcoin is behaving less like a defensive asset and more like a high-risk extension of broader market sentiment. The coming months are likely to determine whether this phase becomes a prolonged reset or a foundation for recovery. For now, caution and disciplined risk management remain essential.
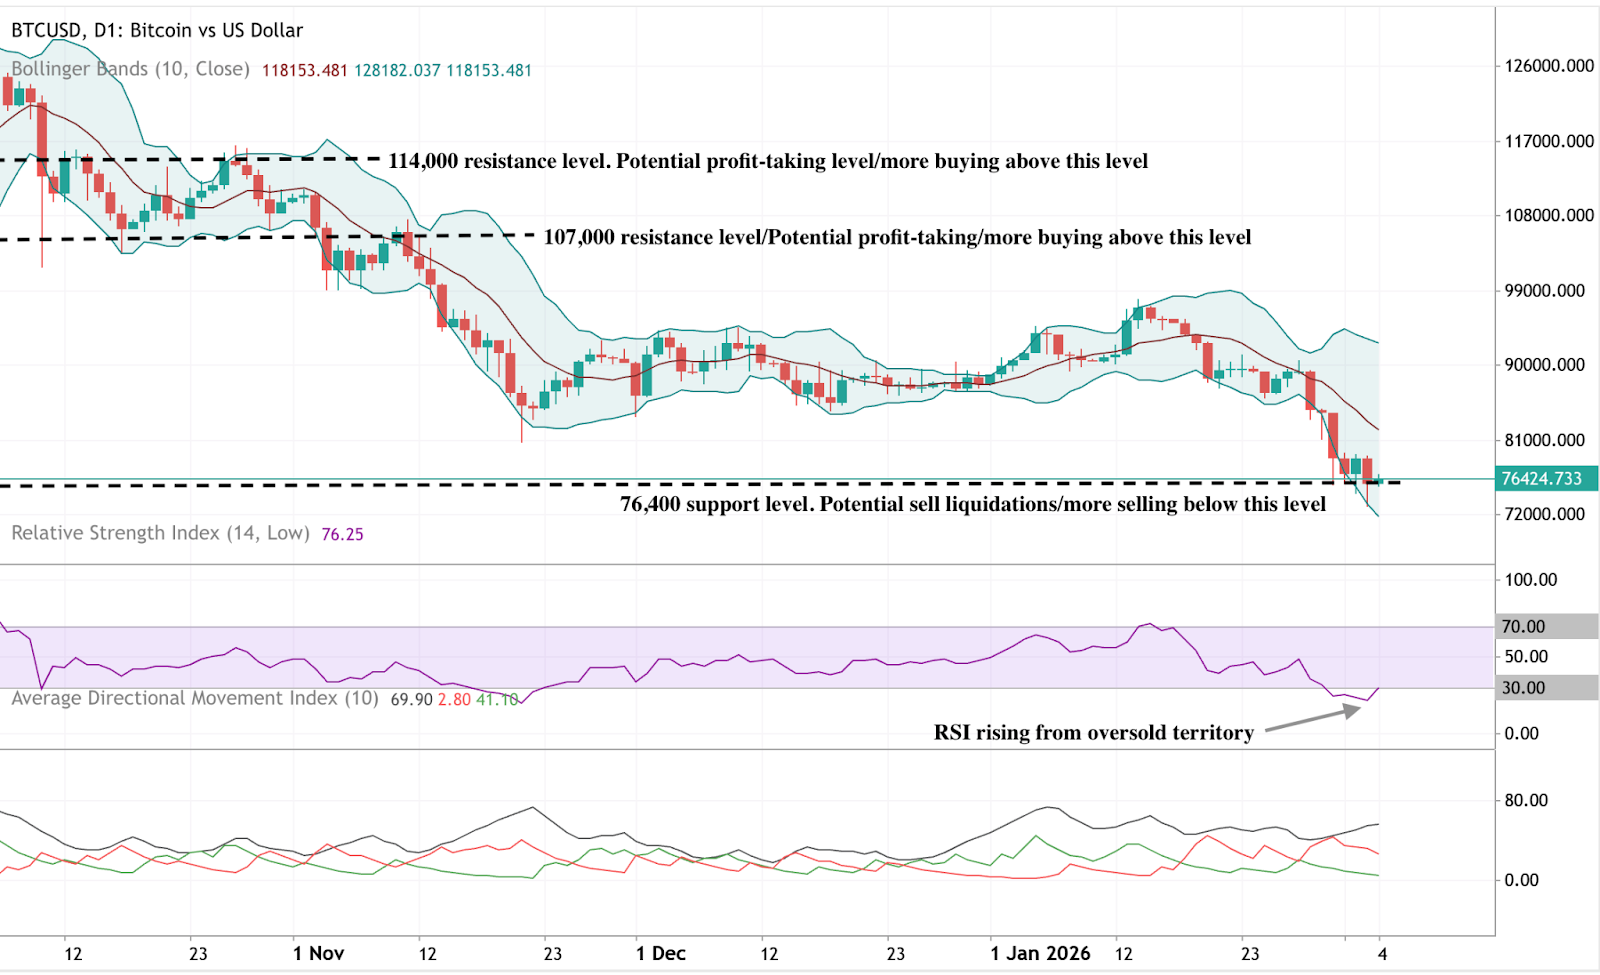
Bitcoin technical outlook
Bitcoin remains under pressure within its broader technical structure, having dipped below the lower Bollinger Band before stabilising near $76,400. The Bollinger Bands are still widely expanded, suggesting volatility remains elevated following the sharp downside move.
Momentum indicators hint at early stabilisation. The RSI has begun to recover from oversold territory, indicating that bearish momentum is easing, even if conviction remains limited. Trend strength, as measured by the ADX, remains elevated, suggesting an active trend environment despite the recent slowdown in directional movement.
From a structural perspective, price remains well below former resistance levels at $90,000, $107,000, and $114,000, underscoring the scale of the prior decline.
إخلاء مسؤولية:
The information contained on the Deriv Market News is for educational purposes only and is not intended as financial or investment advice. The information may become outdated, and some products or platforms mentioned may no longer be offered. We recommend you do your own research before making any trading decisions. The performance figures quoted refer to the past, and past performance is not a guarantee of future performance or a reliable guide to future performance.
الأسئلة الشائعة
Why is Bitcoin falling while gold is rising?
What does a drop below the True Market Mean Price indicate?
Does this mean Bitcoin has entered a bear market?
How long could this phase last?


