المحتويات
مقال
Bitcoin nears inflection point as selling pressure eases
January 26, 2026
مقال
Bitcoin nears inflection point as selling pressure eases
January 26, 2026
مقال
Bitcoin nears inflection point as selling pressure eases
January 26, 2026
.jpg)
Bitcoin is lower by just over 1% over the past 24 hours, but the headline move understates the tension building beneath the surface. Over the weekend, prices drifted dangerously close to confirming a bearish breakdown around the $86,000 region before stabilising, leaving Bitcoin stuck in limbo rather than signalling a clear reversal.
That short-term stabilisation came as on-chain selling activity cooled sharply. However, the absence of strong institutional participation continues to hang over the market. U.S.Bitcoin ETFs have seen more than $1.7 billion in outflows since mid-January, while traders await fresh signals from the Federal Reserve. With cross-asset volatility creeping higher, Bitcoin is approaching a make-or-break moment for its near-term trend.
What’s driving Bitcoin?
Bitcoin’s recent behaviour reflects a technical setup that has been forming gradually rather than abruptly. On the daily timeframe, BTC continues to trade within a head-and-shoulders pattern, a structure often associated with trend exhaustion when confirmed by a decisive break lower.
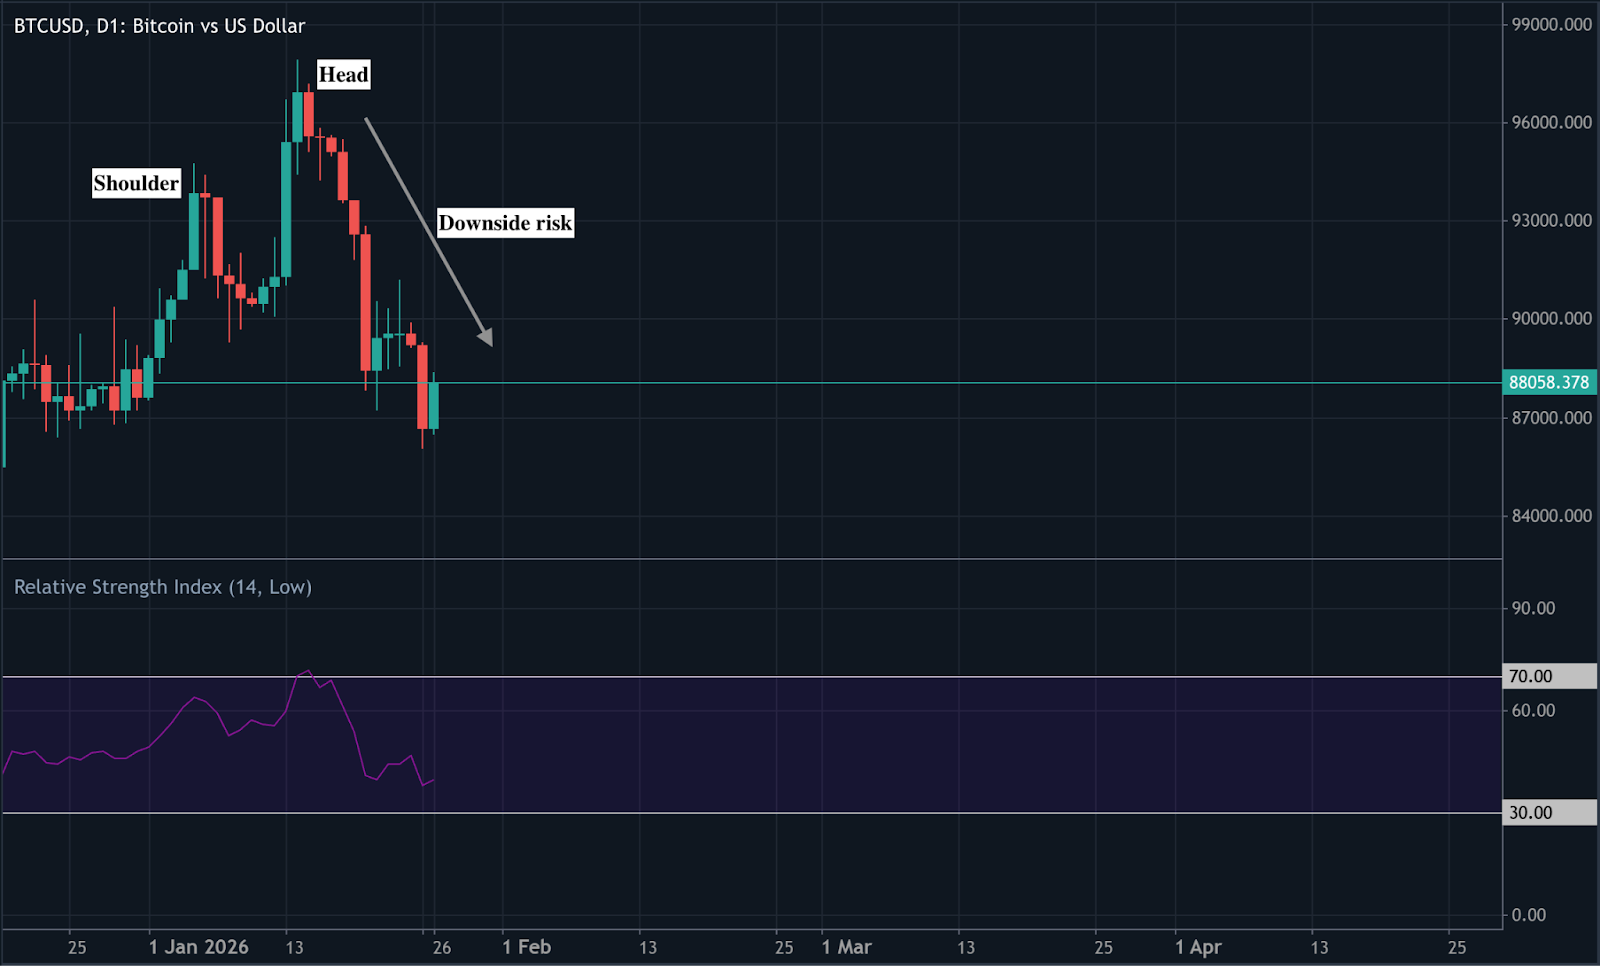
Although the weekend bounce helped Bitcoin avoid an immediate breakdown, the broader pattern has not been invalidated. As long as price remains below key resistance, the risk of renewed downside pressure remains firmly in play.
What shifted more noticeably was the intensity of selling. On-chain metrics show a sharp contraction in coin movement across all age bands. The Spent Coins Age Band indicator dropped from around 27,000 to just under 7,700, signalling a significant slowdown in distribution.
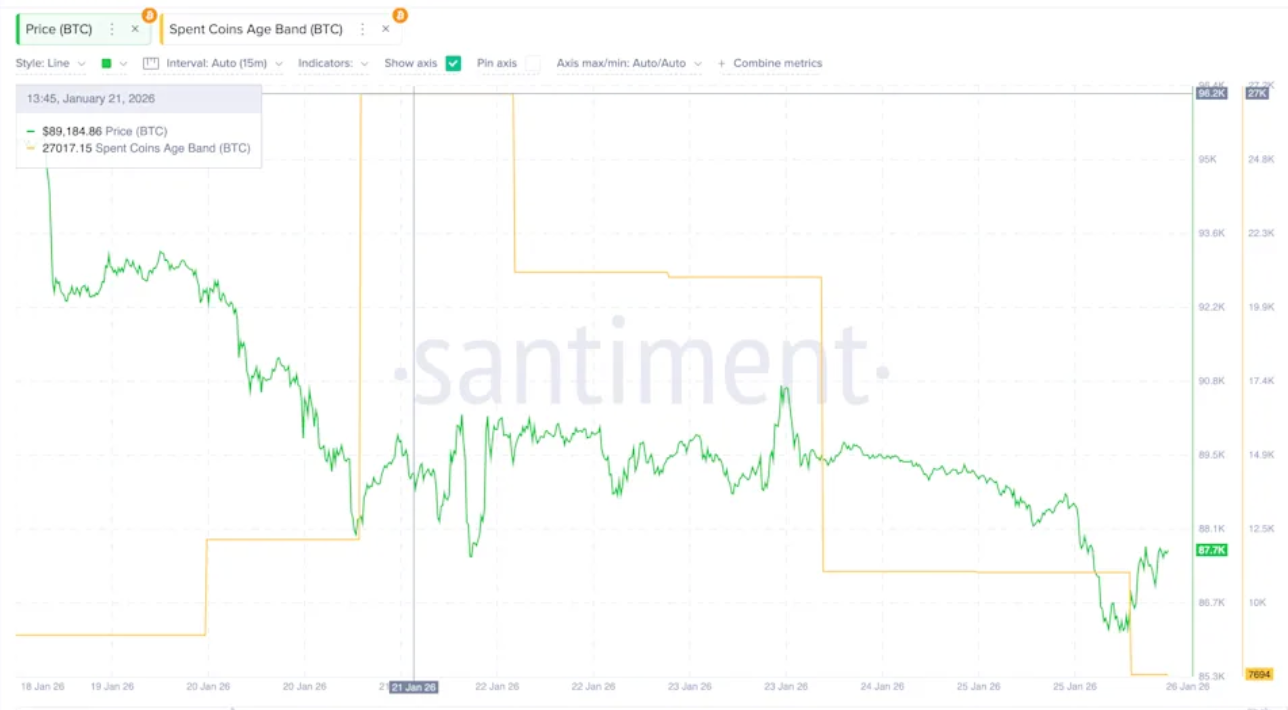
When fewer coins are being transferred on-chain, it often reflects reduced urgency among sellers. That decline in supply pressure helped Bitcoin hold above support, but it does not, on its own, confirm the return of confident buyers.
Why it matters
Institutional positioning remains the key missing ingredient, and ETF data continues to underline that gap. U.S Bitcoin ETFs have recorded multiple sessions of net outflows, including more than $100 million withdrawn on 23 January alone and roughly $1.33 billion over the past week.
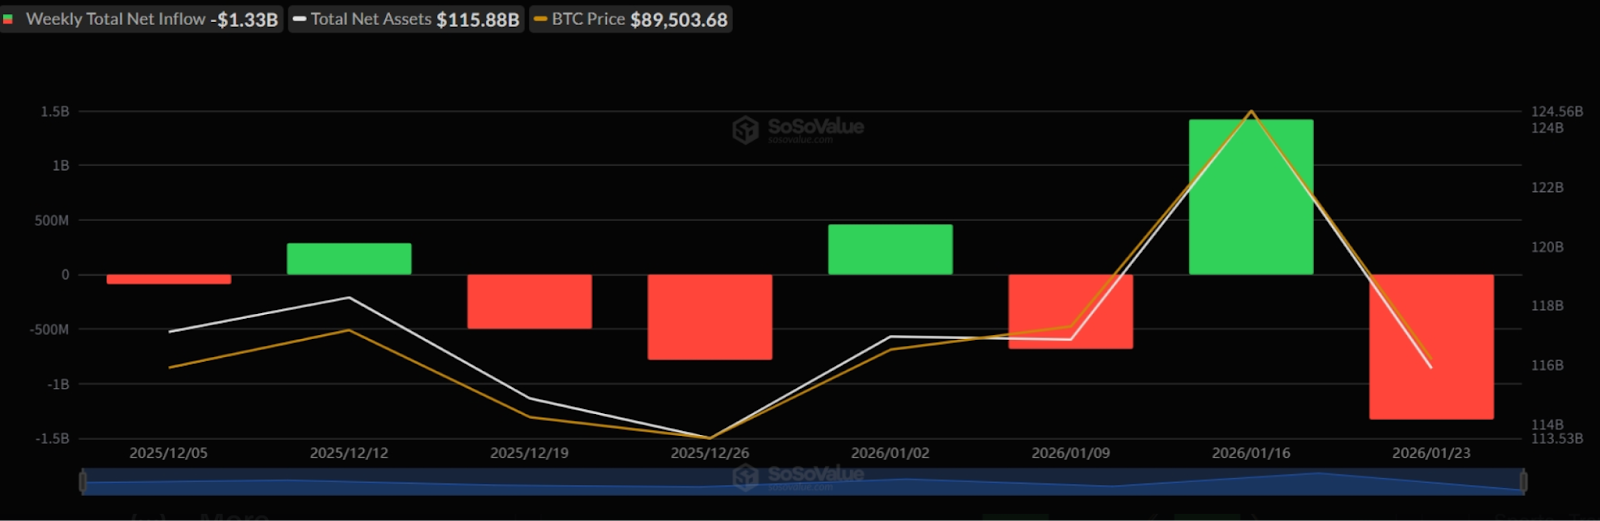
Because these products serve as a primary access point for larger investors, persistent redemptions tend to reflect cautious positioning rather than opportunistic buying. Analysts often view sustained ETF outflows as a sign that conviction is still lacking beneath the surface.
That view is reinforced by commentary from Bitwise CIO Matt Hougan, who has noted that ongoing redemptions often coincide with hedge funds stepping back from the Bitcoin basis trade as returns diminish. According to Amberdata, yields tied to that strategy have fallen below 5%, down from roughly 17% a year ago, reducing the appeal of institutional arbitrage.
Impact on the crypto market
Bitcoin’s indecision has weighed on the broader crypto complex. Ether dropped more than 7% over the past day, falling back below the $3,000 threshold for the first time since early January. Losses across altcoins were even more pronounced, reinforcing a defensive shift within the market.
Despite Bitcoin’s own weakness, its share of total crypto market capitalisation has continued to rise, with dominance nearing 60%. That pattern reflects a familiar risk-off dynamic, where capital gravitates toward the most liquid asset rather than rotating into higher-beta alternatives.
The same defensive tone has been evident across traditional markets. Global equities softened as stress emerged in Japan’s government bond market and renewed U.S. tariff threats unsettled sentiment. The Nasdaq fell close to 2%. In contrast, safe-haven assets outperformed, with gold climbing over 3% and silver surging 7% to fresh record highs. In this backdrop, crypto has continued to trade in line with broader risk assets rather than acting as a hedge.
Expert outlook
Attention now shifts firmly toward macro policy signals. The Federal Reserve is widely expected to leave interest rates unchanged at its January meeting, with CME FedWatch assigning less than a 3% probability to a rate cut.
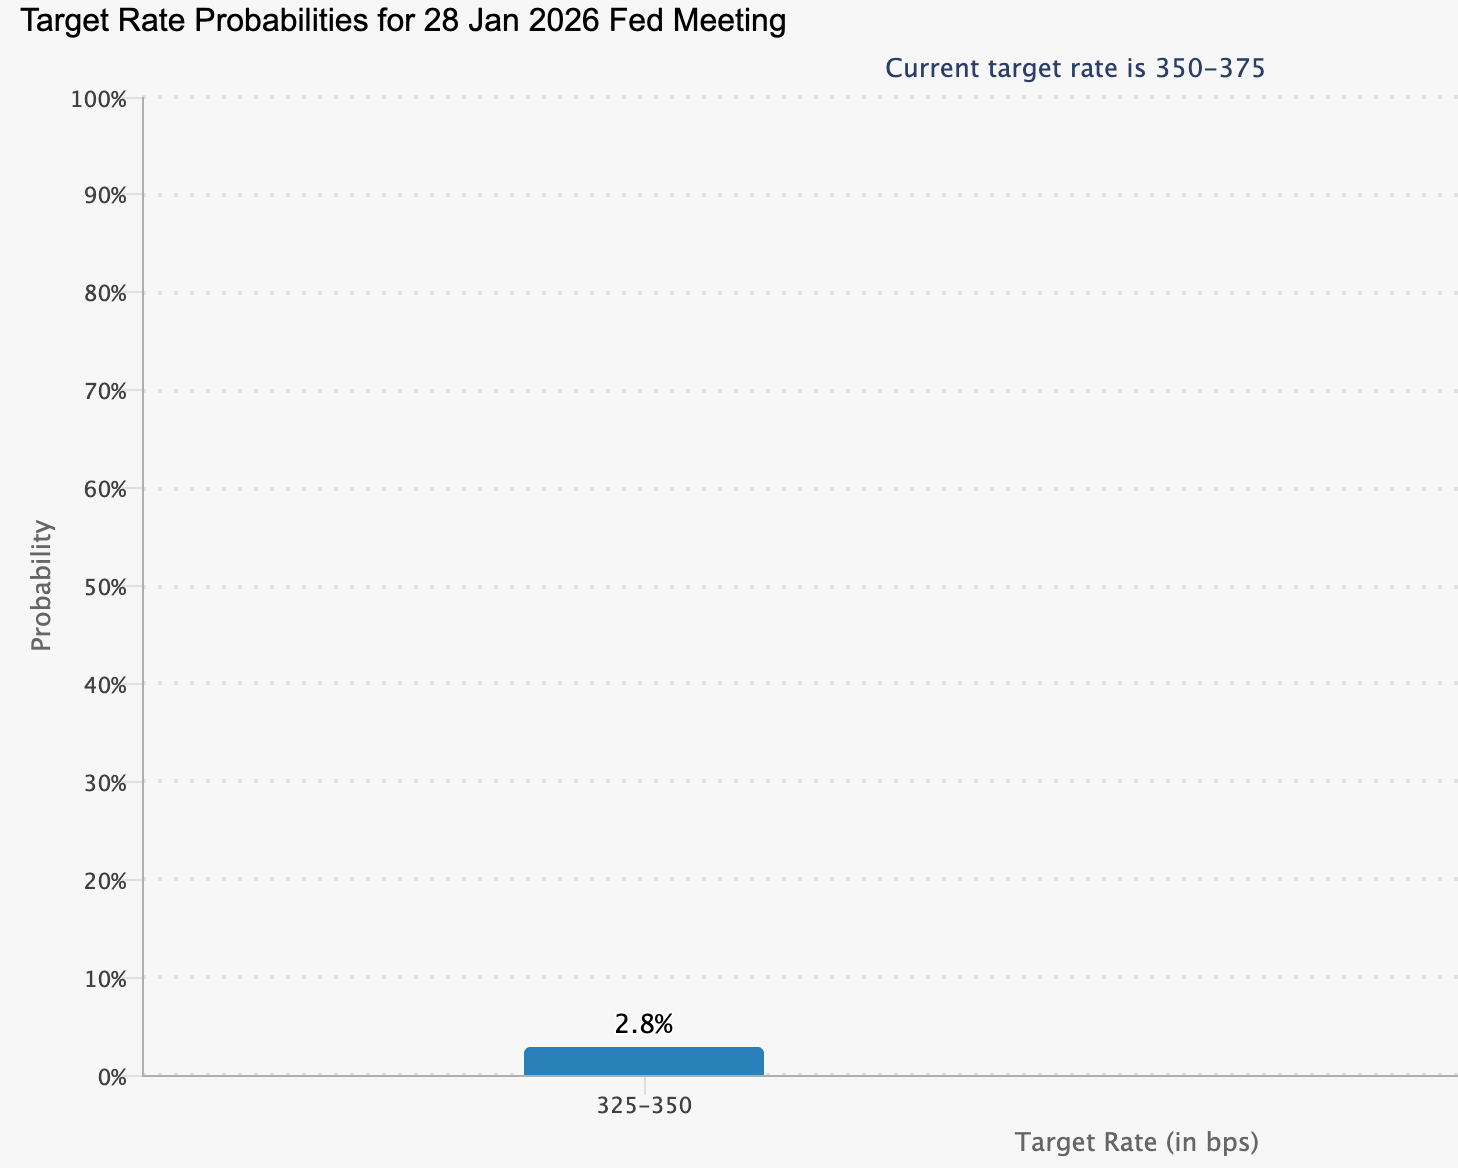
Instead, markets are focused on Chair Jerome Powell’s tone, particularly as delays to key U.S. GDP and consumer spending data have complicated the economic outlook. Any hint of policy pushback could influence risk appetite across markets.
From a trading perspective, ETF flows remain the most closely watched variable. “Volatility is back, and bitcoin is once again trading in line with risk assets,” said Paul Howard of trading firm Wincent, noting that altcoins could remain under pressure if macro uncertainty persists. A sustained recovery above $90,000 would help stabilise sentiment, but failure to regain that level keeps downside risks in focus.
Key takeaway
Bitcoin’s latest rebound reflects a pause in selling rather than a decisive shift in demand. With ETF outflows ongoing and macro uncertainty elevated, the market is approaching a critical juncture. How price behaves around key technical levels, alongside signals from the Federal Reserve and ETF flow data, will shape the next phase. For now, Bitcoin remains stable, but not yet secure.
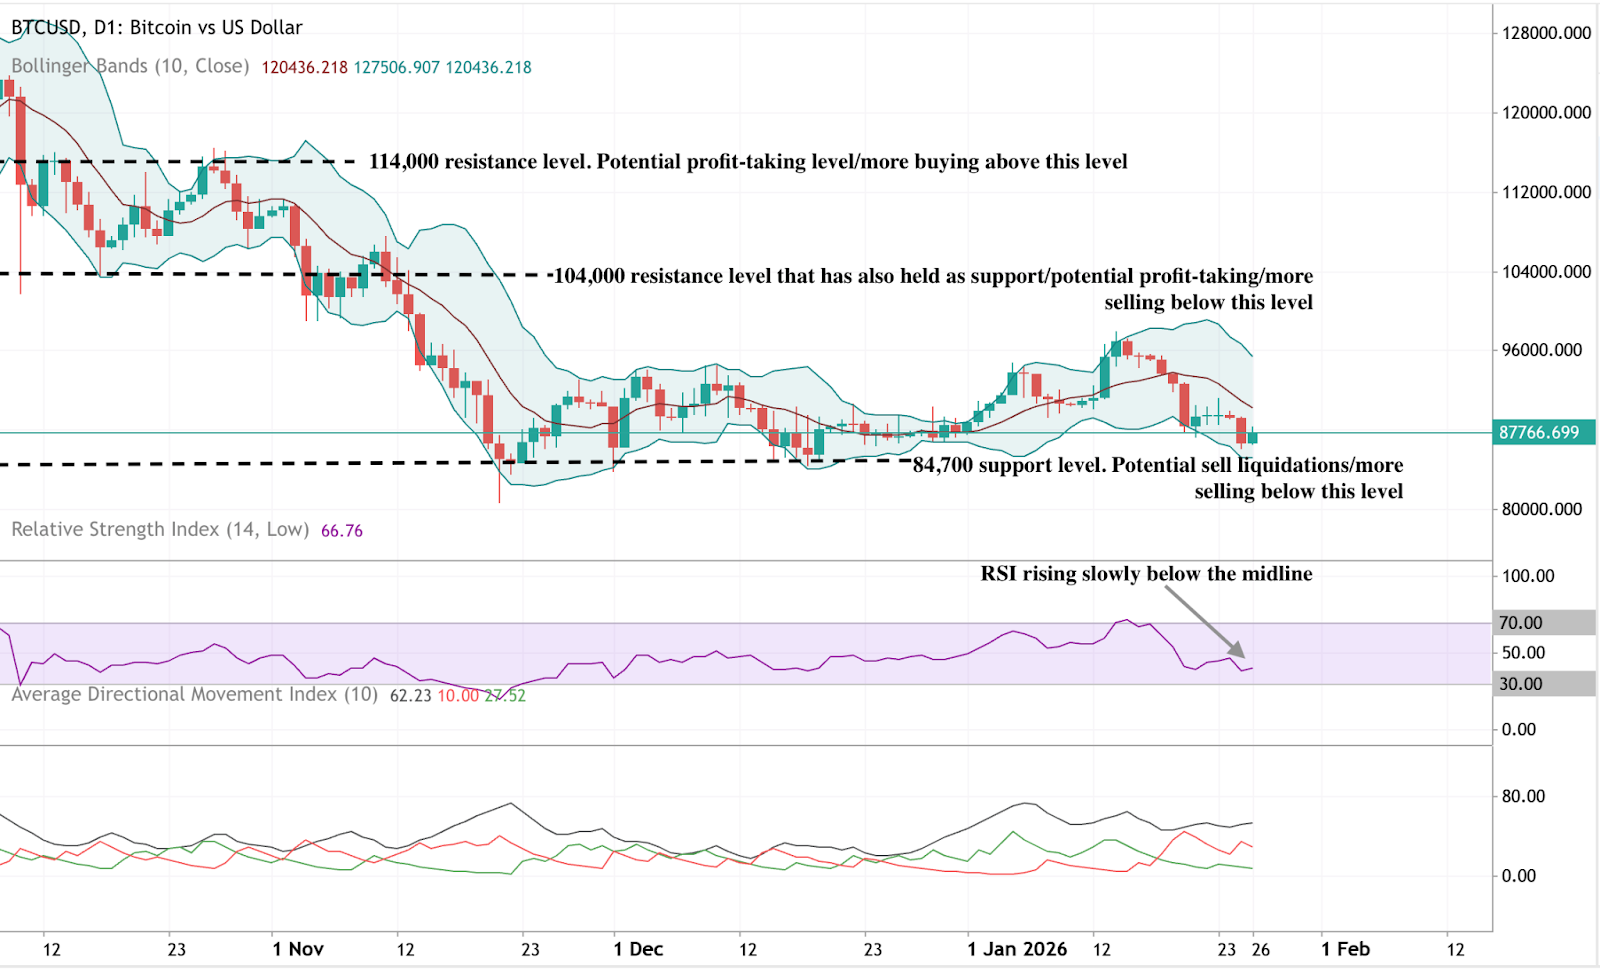
Bitcoin technical outlook
Bitcoin continues to consolidate after its earlier pullback from highs, with price action confined to a broad range and trading below the midpoint of the Bollinger Bands. The narrowing of the bands suggests compressed volatility and a cooling of directional momentum compared with previous phases.
Momentum indicators echo this consolidation. The RSI has been grinding higher but remains below the midline, suggesting upside momentum remains muted. Trend strength, as reflected by an elevated ADX reading, remains firm, although directional signals suggest the trend has lost acceleration.
From a structural perspective, price continues to oscillate between established support near $84,700 and former resistance zones around $104,000 and $114,000. This range-bound behaviour points to a market in equilibrium, where balance has replaced decisive price discovery.
إخلاء مسؤولية:
The performance figures quoted refer to the past, and past performance is not a guarantee of future performance or a reliable guide to future performance.
الأسئلة الشائعة
Why did Bitcoin rebound near $86,000?
Are Bitcoin ETF outflows still a concern?
Could Bitcoin still fall toward $78,000?
How important is the Federal Reserve for Bitcoin right now?
Why are altcoins underperforming Bitcoin?


