المحتويات
مقال
Bitcoin’s redemption arc: Will the $90,000 rebound survive the squeeze?
November 27, 2025
مقال
Bitcoin’s redemption arc: Will the $90,000 rebound survive the squeeze?
November 27, 2025
مقال
Bitcoin’s redemption arc: Will the $90,000 rebound survive the squeeze?
November 27, 2025

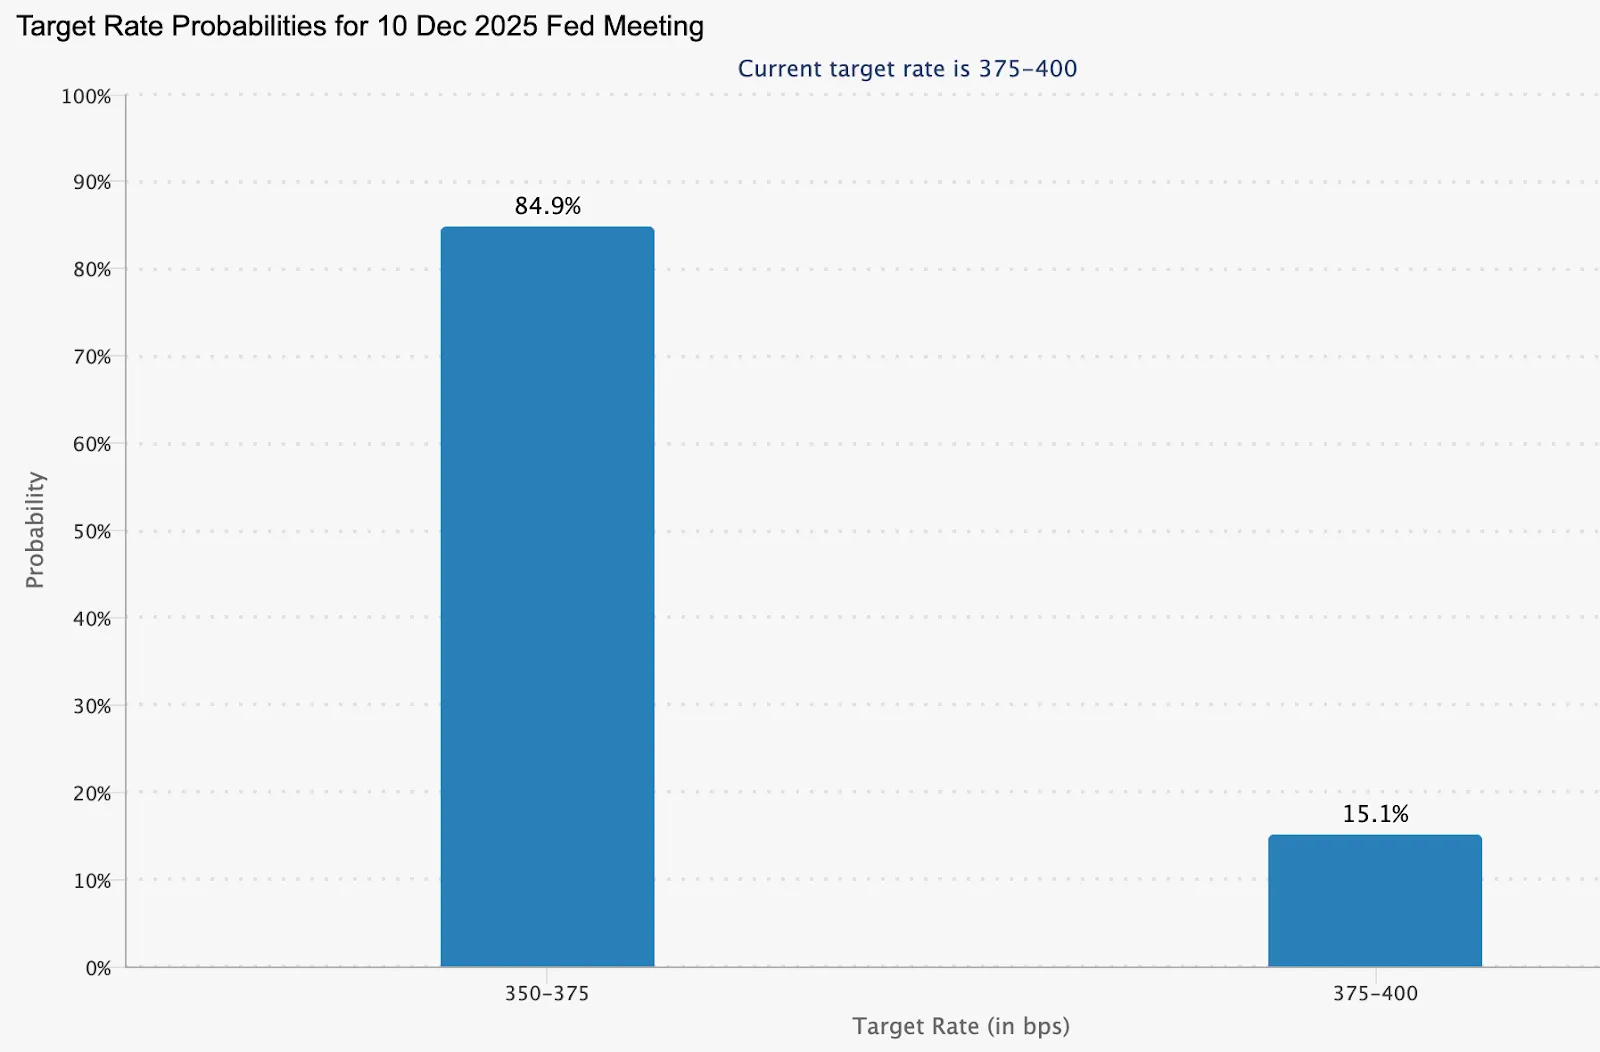
Analysts note that Bitcoin’s attempt at a comeback has pushed the asset back above $90,000, reigniting debate over whether this rebound has real staying power or simply reflects a temporary lift in sentiment. The climb follows a sharp recovery from the ~$80,400 low recorded just days ago, driven largely by rising expectations that the Federal Reserve could cut rates in December and a broader improvement in risk appetite across markets.
Still, Bitcoin’s position remains precarious, with month-on-month performance showing BTC nearly 19% lower, reminding traders that the current move sits on fragile ground.
Analysts say the market is now caught between two competing forces: renewed optimism built on the possibility of policy easing, and an ongoing deterioration in liquidity that continues to weigh on ETF flows and spot demand. For Bitcoin to sustain this rebound, it must clear the cluster of resistance between $92,000 and $95,000, while attracting more steady retail and institutional participation.
The next stretch will reveal whether this recovery evolves into something stronger - or slips back into correction.
What’s driving Bitcoin’s latest move
Bitcoin’s recent rise has been propelled by shifting macro expectations. Traders have increased bets on a December rate cut, helping revive demand for risk assets after a stretch of heavy selling. This shift enabled BTC to reclaim the $90,000 level after dipping to the low $80,000 range last week.
Yet, the underlying backdrop remains tough: inflation remains elevated, and QCP Capital warns that “supply is likely to cap BTC in the mid-$90,000’s,” highlighting the risk that the current move could be running into a wall.
ETF activity reinforces this caution. After a surge of record withdrawals, reports suggest that U.S. bitcoin ETFs have struggled to attract steady inflows, signalling uncertainty among institutions. In parallel, major corporate holders haven’t strengthened sentiment either. MicroStrategy - long viewed as a bellwether for institutional Bitcoin adoption - is only just approaching break-even and now faces potential removal from the MSCI index. These undercurrents suggest Bitcoin’s rebound owes more to macro positioning than to a meaningful resurgence in capital flows.

Why it matters
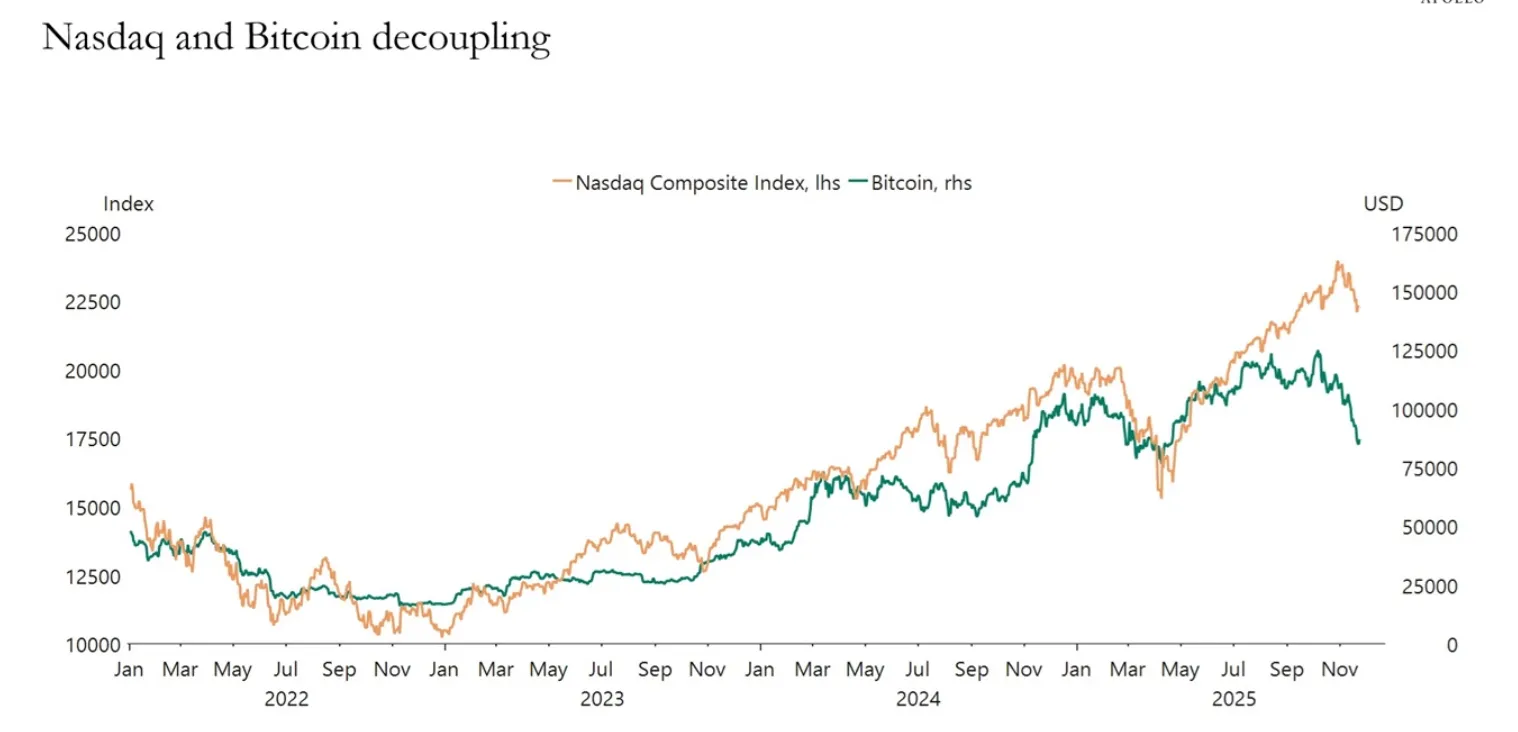
This widening gap between Bitcoin’s price action and its underlying liquidity is becoming increasingly visible. Torsten Slok, chief economist at Apollo, notes that Bitcoin’s typical correlation with the Nasdaq has weakened, with BTC falling far more sharply during the recent downturn. This divergence raises concerns about crypto-specific liquidity constraints at a time when equity markets appear to be stabilising.
Research from 10X Research adds another layer. They warn that markets may be placing too much faith in the bullish implications of a December rate cut. Historically, Bitcoin has reacted more strongly to the tone and messaging from the Federal Reserve than to the policy move itself. A cautious or hawkish press conference could quickly unsettle markets. Their analysis also challenges the assumption that Treasury General Account (TGA) spending will meaningfully boost crypto liquidity, noting earlier TGA releases took as long as two months to appear in Bitcoin’s price - and even then, only weakly.
Impact on industry, markets, and consumers
Bitcoin’s move back above $90,000 has shored up confidence at the psychological level, but structural signals remain mixed. Year-to-date, BTC is still 5% lower, and ETF products have only recently stopped bleeding after heavy outflows contributed to the drop toward $80K. The bounce has offered relief, but not enough to signal a sustained continuation of the uptrend.
Institutional flows are slowly improving. VALR CEO Farzam Ehsani noted spot ETFs recorded inflows for the first time in weeks - “an early sign of institutional liquidity returning after aggressive de-risking.” Traders observing the market on Deriv MT5 have also highlighted how Bitcoin continues to pivot around the $90,000 level, with shorter timeframes showing fast swings between accumulation and profit-taking. During these volatile conditions, tools like the Deriv trading calculator have become valuable for traders assessing position costs, risk, and exposure as BTC approaches technical barriers.
According to market watchers, Bitcoin’s behaviour still drives the broader digital-asset environment. A clean break and sustained hold above $90,000 could revive liquidity across altcoins and stablecoins, while failure at these levels risks re-igniting forced selling and eroding sentiment across the sector.
Expert outlook
Analysts at 10X Research suggest Bitcoin could continue consolidating into late January 2026 if historical TGA-driven liquidity lags repeat.
Some strategists remain sceptical that a bottom is in. Compass Point analyst Ed Engel argues that this phase resembles classic bear-market behaviour - short and sharp relief rallies followed by strong selling into strength. Engel said he wants to see clear accumulation from long-term holders and deeper short positioning in futures before turning constructive. Without those signals, he believes Bitcoin will face stiff resistance if it attempts to test the $92,000–$95,000 range again.
Key takeaway
Bitcoin reclaiming the $90,000 region marks a significant milestone in its recovery, but the foundation beneath the move remains thin. Resistance near $92,000–$95,000, weak ETF inflows, and a fragile liquidity backdrop raise questions about whether the rebound can hold. Traders now await the Federal Reserve’s December messaging and a possible return of retail and institutional volume to determine whether Bitcoin can strengthen further - or stall at familiar resistance.
Bitcoin technical insights
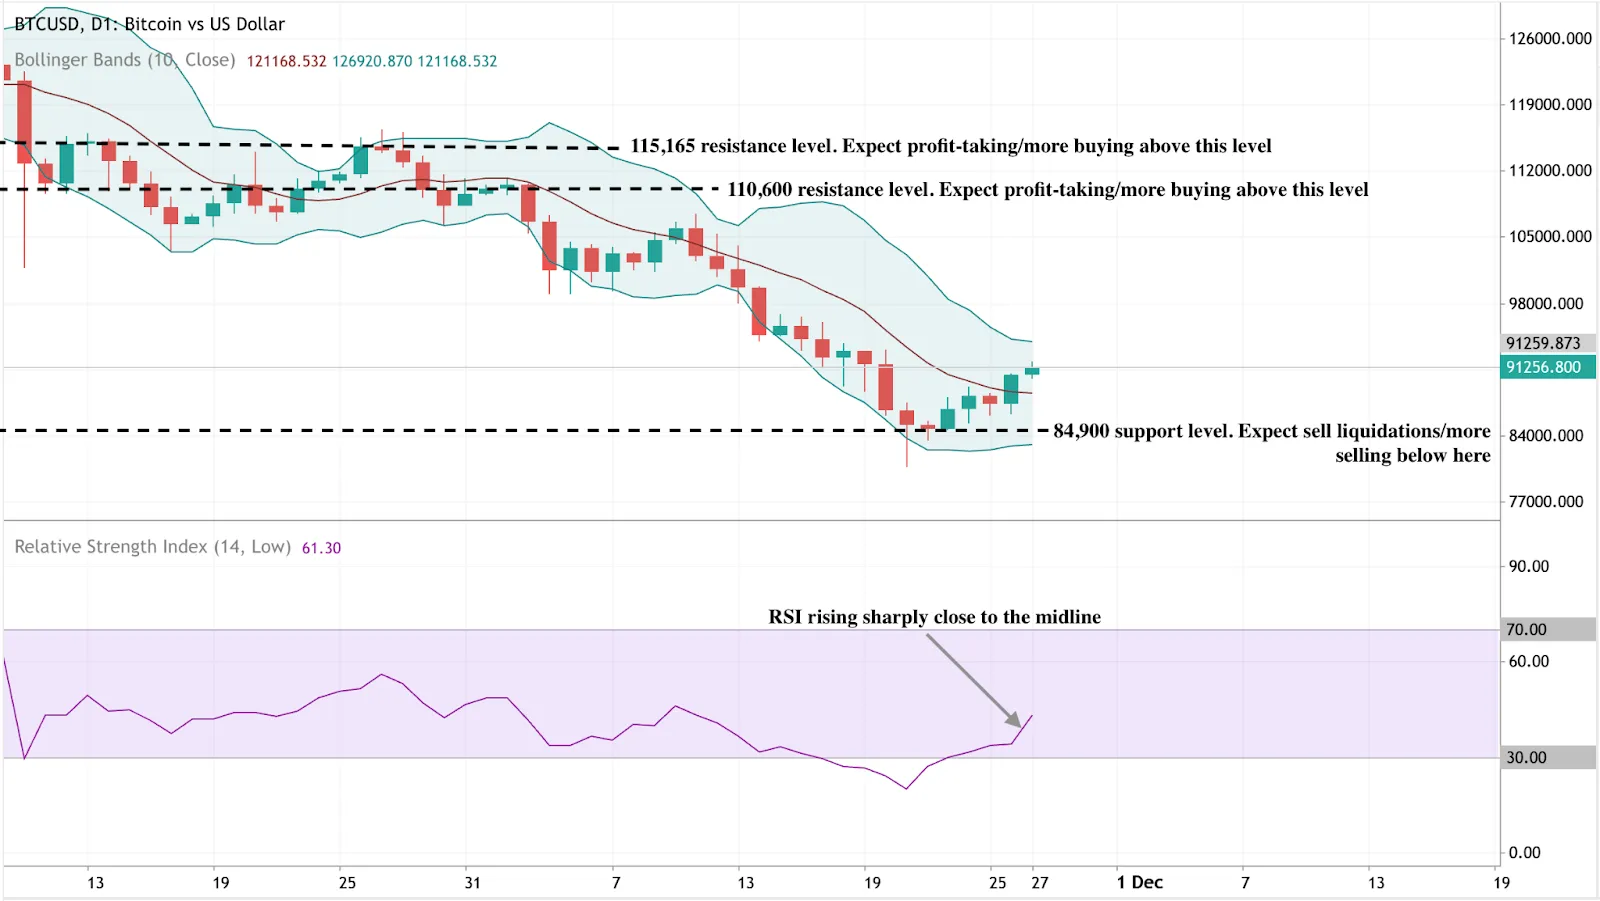
Bitcoin (BTC/USD) is currently attempting to build on its recovery, trading near $91,200 after rebounding from the key $84,900 support zone. Maintaining this level is essential; a break below could trigger liquidations and re-open the downside trend. To the upside, BTC faces important resistance at $110,600 and $115,165, where bullish continuation may encounter profit-taking or renewed buying interest.
The price remains contained within its Bollinger Bands, with BTC starting to lift toward the middle band after a prolonged period of weakness. This hints at early stabilisation, though the broader trend remains cautious until the market clears resistance decisively. The RSI has risen toward 61, climbing from oversold territory and showing an improvement in bullish momentum without yet signalling overbought conditions.
إخلاء مسؤولية:
The performance figures quoted are not a guarantee of future performance.
الأسئلة الشائعة
Why is Bitcoin struggling to hold above $90,000?
Are rate-cut expectations driving Bitcoin’s recovery?
Why have ETF flows been weak?
How influential is the TGA on Bitcoin’s price?
How far is Bitcoin from its all-time high?


