المحتويات
مقال
Bitcoin slips below $90K: Breakdown, reset, or buying window?
December 17, 2025
مقال
Bitcoin slips below $90K: Breakdown, reset, or buying window?
December 17, 2025
مقال
Bitcoin slips below $90K: Breakdown, reset, or buying window?
December 17, 2025

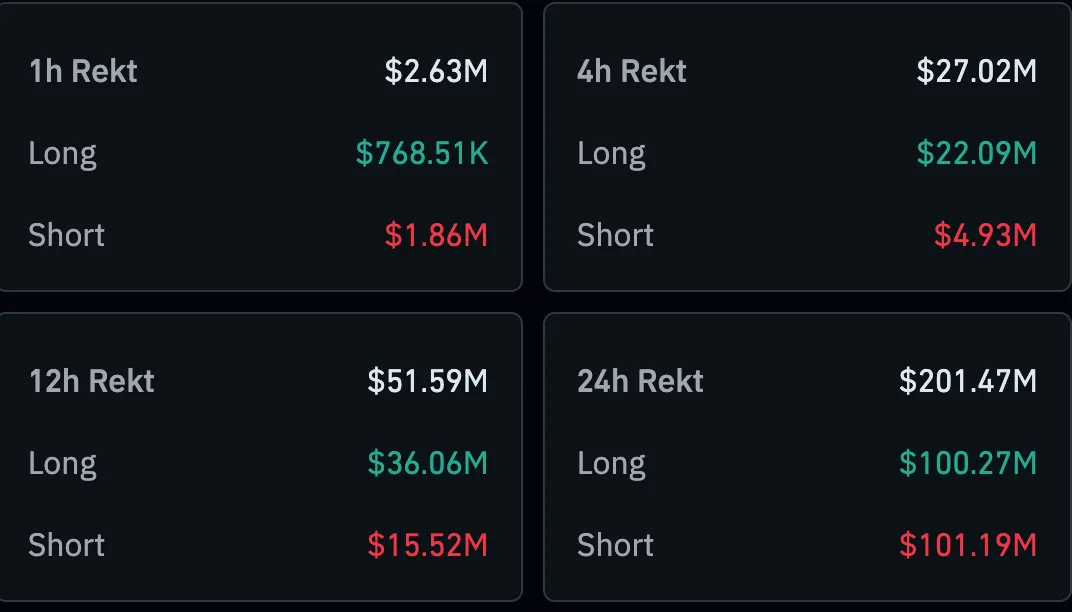
Bitcoin’s slide below the $90,000 threshold does not point to a market collapse, but it does signal a shift in momentum. The move appears to be driven by a broader macroeconomic reset, where traders have reduced risk and unwound leverage rather than abandoning long-term conviction. Over the weekend, prices dipped into the mid-$85,000 region as more than $400 million worth of crypto positions were liquidated in a single day, according to CoinGlass.
Market sentiment has weakened markedly. The Crypto Fear and Greed Index fell to around 16, placing it firmly in “extreme fear” territory, even as the total crypto market capitalisation stabilised above $3.1 trillion.
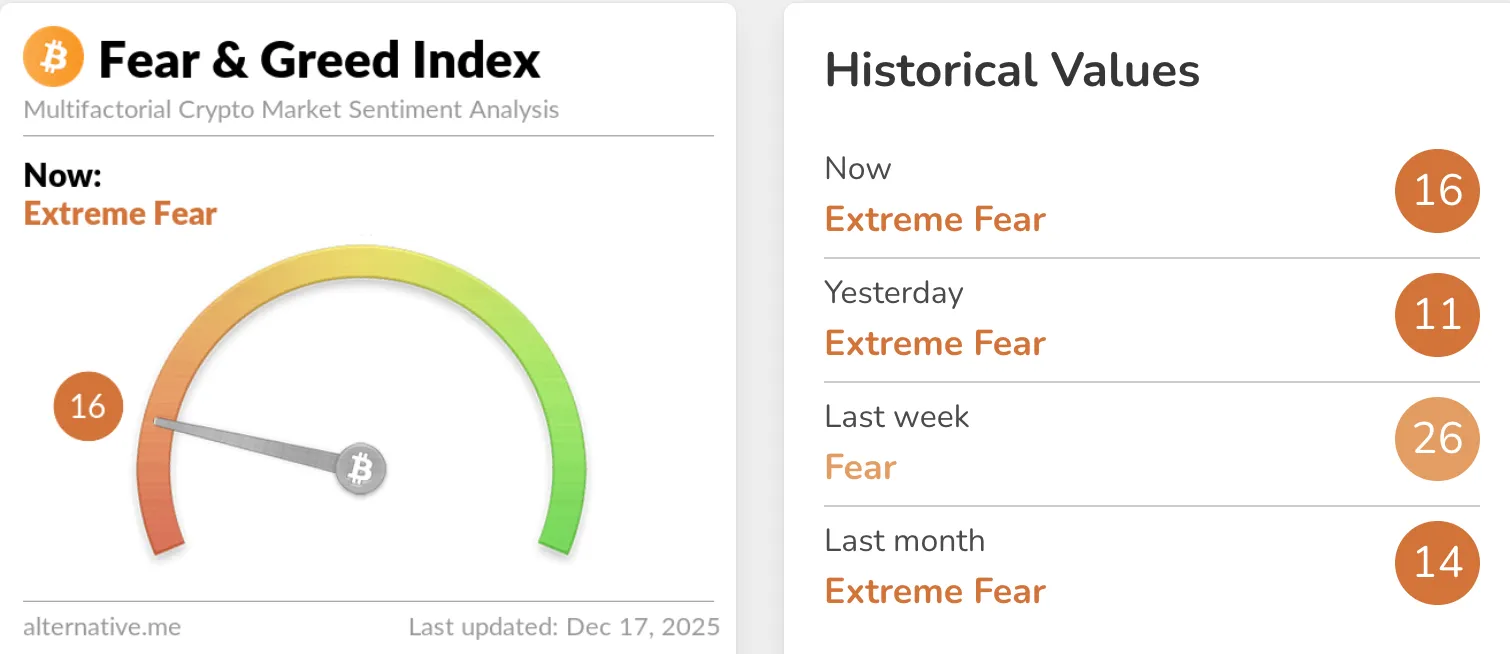
That mix of intense pessimism without clear capitulation suggests the market may be probing for a base, analysts noted. Whether this phase evolves into a genuine buying opportunity now hinges less on crypto-specific developments and more on how global monetary policy unfolds in the weeks ahead.
What’s driving bitcoin’s slide?
Bitcoin’s inability to reclaim the $90,000 level reflects a clear turn towards caution across financial markets. The latest rebound lost traction as macroeconomic uncertainty resurfaced, prompting traders to scale back exposure. CoinGlass data shows that $201.52 million in crypto positions were liquidated over the past 24 hours, with long positions accounting for just over $100 million of that total.
Macroeconomic factors remain central to the move. Attention has shifted to the Bank of Japan, where economists broadly expect a 0.25% interest-rate increase at this week’s policy meeting. Such a step would widen the policy gap with the US Federal Reserve, which has already begun cutting rates. That divergence risks accelerating the unwinding of yen-funded carry trades that have supported global risk assets, including cryptocurrencies. Thin December liquidity has amplified these effects, allowing relatively modest selling pressure to push prices lower.
Why it matters for market sentiment
The importance of bitcoin’s pullback lies less in the exact price level and more in what sentiment indicators are signalling. A Fear and Greed Index reading deep in extreme fear suggests investors are prioritising capital protection over chasing upside. Historically, similar conditions have often coincided with local market lows, although they have also persisted during extended periods of macroeconomic stress.
Institutional behaviour has reinforced the cautious tone, analysts said. Bitcoin exchange-traded funds recorded more than $3.48 billion in net outflows last month, the largest monthly drawdown since February. While modest inflows have returned this month, they have yet to meaningfully shift sentiment. As one digital asset strategist told Reuters, “When ETF demand stalls, bitcoin becomes far more sensitive to macro shocks.”
Impact on the broader crypto market
The wider crypto market has tracked bitcoin’s weakness without showing signs of full capitulation. Analysts note that most major altcoins have struggled to gain traction, with many posting double-digit losses over the past month and failing to respond to bitcoin’s modest bounce. Bitcoin dominance has climbed towards 57%, indicating a defensive rotation within the digital asset space rather than a renewed appetite for higher-risk tokens.
At the same time, participation remains robust. Reports indicate that Bitcoin’s 24-hour trading volume has increased by more than 70% to approximately $51 billion, suggesting active repositioning rather than disengagement. This combination of elevated activity and subdued price action reflects a market waiting for clearer direction.
Expert outlook: collapse, reset, or buying window?
Most analysts characterise the current phase as a reset rather than a collapse. The pullback has been driven by leverage unwinds, policy uncertainty, and shifts in positioning, rather than by structural damage to Bitcoin’s adoption narrative.
Corporate-related concerns have also weighed on sentiment. Recent headlines suggesting that large bitcoin-holding companies briefly explored asset sales to fund dividends unsettled markets, even though those fears were later eased. The episode nevertheless highlighted how balance-sheet pressures could become a factor if financial conditions tighten further.
Whether this reset turns into a buying window depends on upcoming signals. A Bank of Japan rate hike could prolong risk-off conditions if carry trades unwind aggressively, while continued uncertainty around US monetary policy would likely keep markets on edge. Conversely, stabilising ETF flows and improving liquidity could help sentiment recover quickly. For now, Bitcoin appears confined to a consolidation range, with downside pressure driven more by macroeconomic nerves than a loss of confidence.
Key takeaway
Bitcoin’s move below $90,000 is best viewed as a macro-driven reset rather than a collapse. Extreme fear, ETF outflows, and central-bank uncertainty have weighed on risk appetite, even as trading activity remains elevated. History suggests such conditions can create opportunity, but timing remains uncertain. The next signals from global central banks and institutional flows will be key in determining whether this phase evolves into a genuine buying window.
Bitcoin technical insights
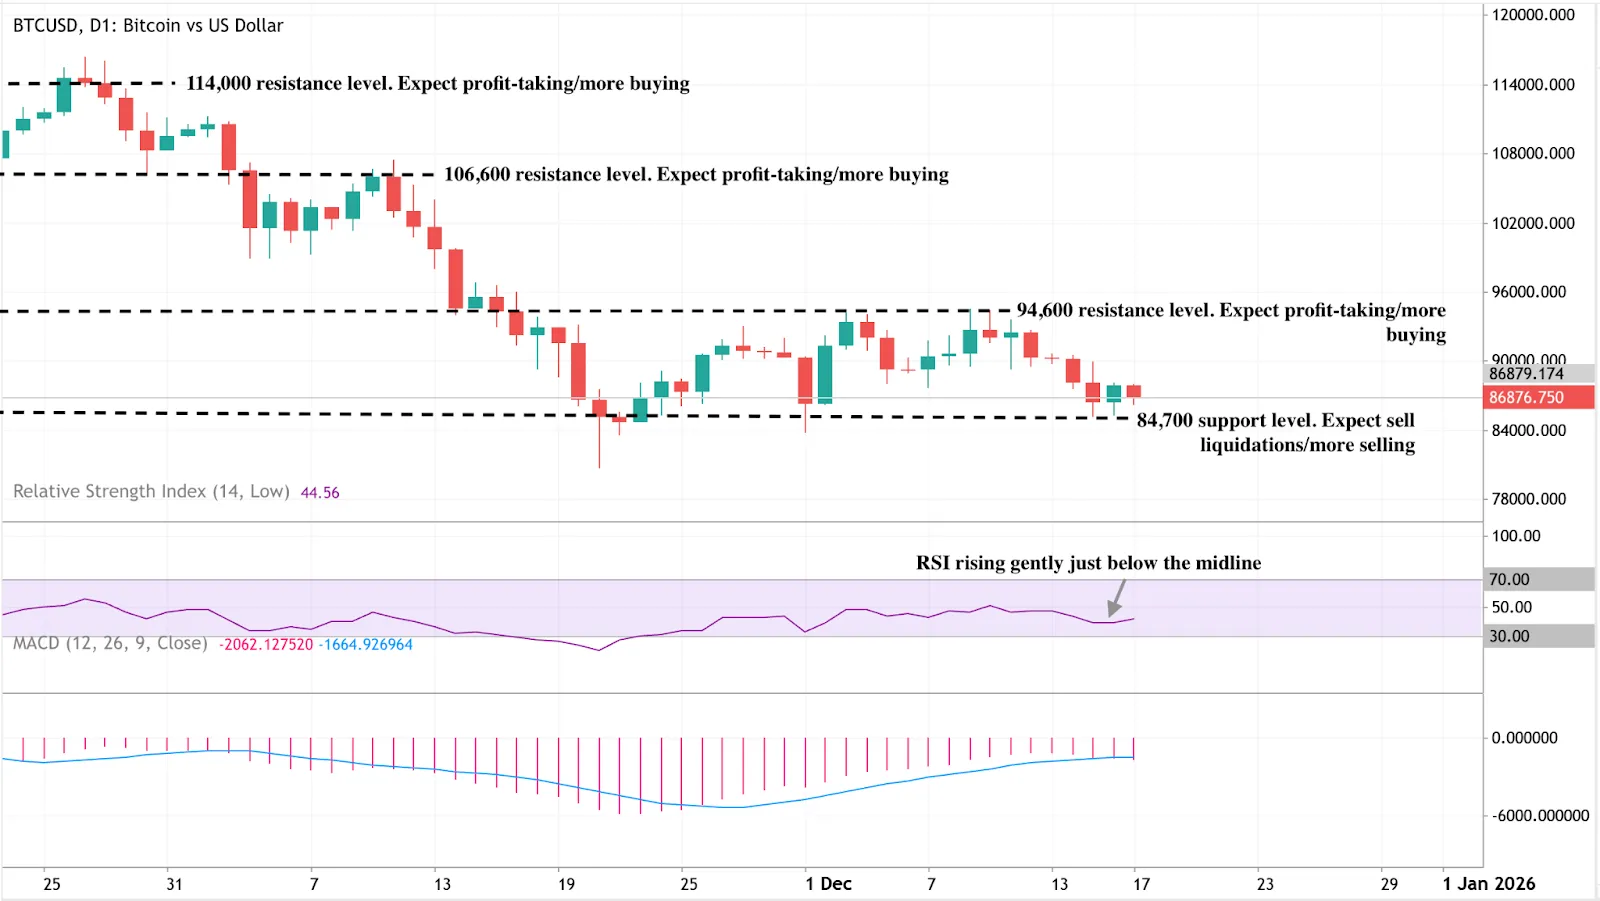
From a technical standpoint, Bitcoin remains in a corrective consolidation after its sharp pullback from the $114,000 highs. The price is holding just above the $84,700 support zone, a level that is increasingly viewed by traders as a near-term line in the sand. A decisive break below this area could open the door to another wave of liquidation-driven selling, particularly given the still-elevated use of leverage across derivatives markets.
Momentum indicators point to caution rather than panic. The RSI is edging higher but remains below the 50 midpoint, suggesting bearish pressure is easing without confirming a trend reversal. The MACD remains in negative territory, although its histogram is gradually improving, suggesting that downside momentum is slowing. Traders tracking these signals on platforms such as Deriv MT5 are paying close attention to price behaviour around key levels, while tools like the Deriv Trading Calculator are being used to assess margin exposure and potential risk should volatility pick up.
On the upside, recovery attempts remain capped by resistance around US$94,600, followed by a more significant barrier near US$106,600. Until one of these levels is convincingly cleared, bitcoin is likely to remain range-bound, with technical traders waiting for a clearer catalyst before committing to a directional move.
إخلاء مسؤولية:
The performance figures quoted are not a guarantee of future performance.
الأسئلة الشائعة
Why did Bitcoin fall below $90,000?
What does “extreme fear” mean for crypto markets?
Are bitcoin ETFs still seeing outflows?
How does the Bank of Japan affect bitcoin prices?
Is high trading volume a bullish sign?


