المحتويات
مقال
Gold price crash: Is this a correction or start of a crash?
October 23, 2025
مقال
Gold price crash: Is this a correction or start of a crash?
October 23, 2025
مقال
Gold price crash: Is this a correction or start of a crash?
October 23, 2025

Analysts suggest gold’s sharp fall is less a collapse and more a pause for consolidation after one of the strongest rallies in modern market history. On Tuesday, the gold price plunged 5.7% - its steepest one-day drop since 2013 - erasing close to $2.5 trillion in market value in gold within a single session.
Yet the underlying story remains unchanged. Inflation is still firm, central banks continue to buy at record pace, and expectations for U.S. rate cuts persist. Rather than signalling weakness, this pullback appears to be a natural reset after gold’s parabolic run to $4,381 per ounce. The market, it seems, is catching its breath - not losing its footing.
Key takeaways
- Gold prices fell 5.7% in one session, the biggest daily drop since 2013, while silver slid 9%, its worst performance since 2020.
- Combined, the metals lost nearly $3 trillion in market capitalisation over 24 hours.
- The drop followed a record nine-week rally that pushed gold to new all-time highs.
- Gold’s RSI peaked at 91.8, the highest level ever recorded, confirming extreme overbought conditions.
- Despite the correction, gold remains up more than 55% YTD, supported by sticky inflation, sustained demand, and rate-cut expectations.
The run-up: When gold and silver broke records
Before the selloff, gold had entered uncharted territory. Prices surged past $4,380, powered by strong inflows into exchange-traded funds (ETFs), persistent geopolitical tension, and growing confidence that the Federal Reserve was preparing to loosen policy. Silver, too, outperformed spectacularly - rising 85% YTD, its best stretch in over four decades.
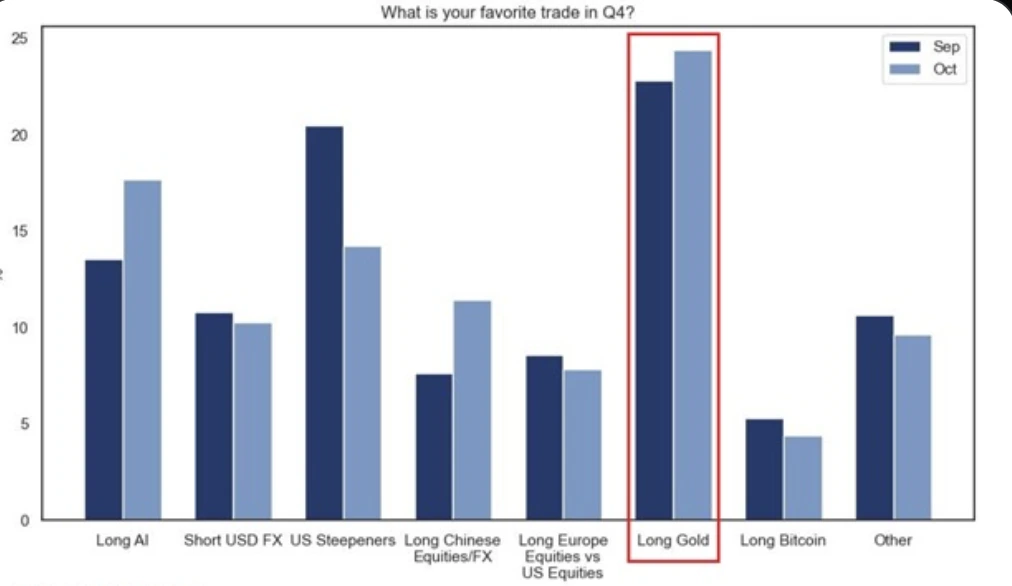
Both metals dramatically outpaced global equities and even high-growth tech stocks. According to Goldman Sachs, roughly one in four institutional investors identified “long gold” as their top trade - surpassing enthusiasm for AI-linked equities.
Gold’s ascent was relentless. The metal had gained for nine consecutive weeks, only the fifth such streak ever recorded. Historically, each of the previous four ended with a temporary pullback averaging 13% within two months. Analysts now view this latest correction as a similar case of momentum finally giving way to gravity.
The drop: When record highs met gravity
Gold’s reversal wasn’t triggered by a single event but by a convergence of market dynamics. After months of persistent gains, investors began locking in profits ahead of the long-delayed release of U.S. CPI data. With speculative long positions at multi-year highs, even modest selling pressure quickly escalated as automated strategies accelerated the move.
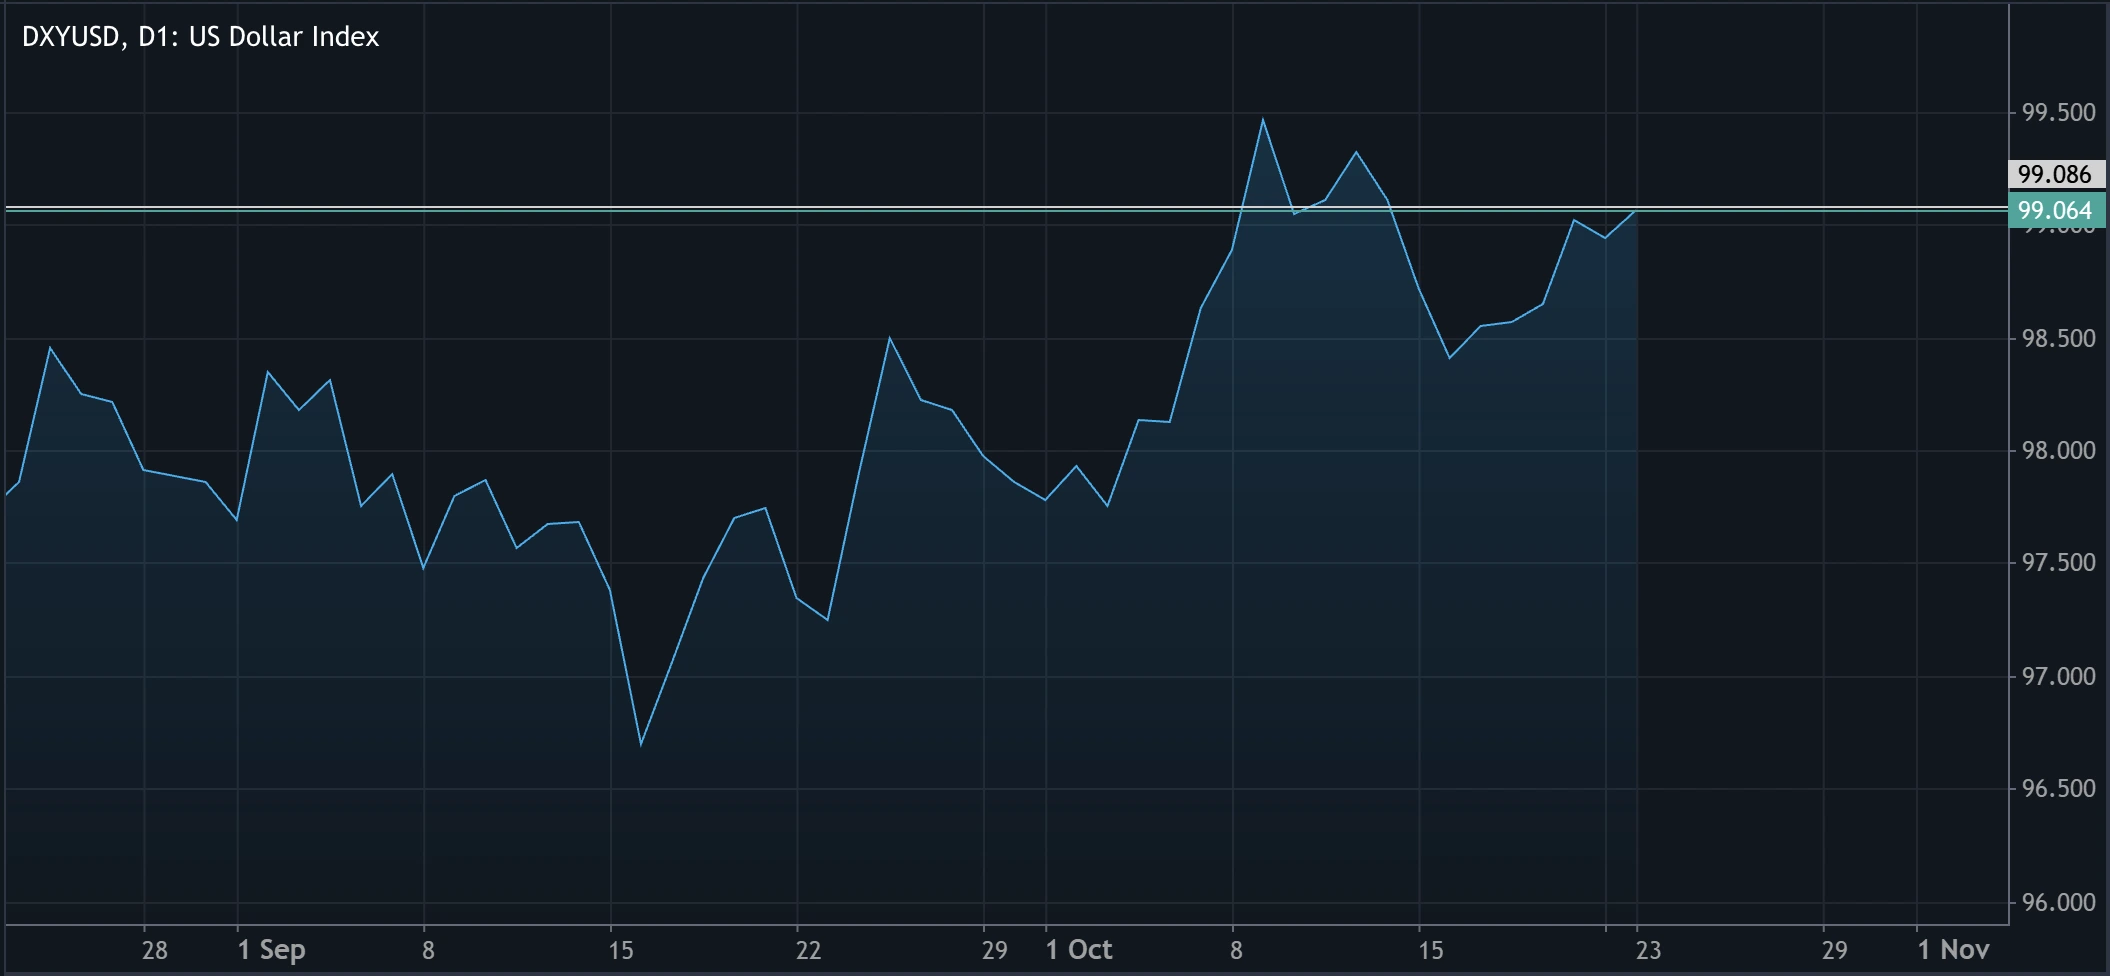
At the same time, the U.S. dollar strengthened, making gold more expensive for global buyers and further dampening short-term demand. The dollar’s rebound came at the worst possible moment for the metal, amplifying downside momentum.
Adding to this, a shift in sentiment around global trade reduced demand for safe-haven assets. Renewed optimism over talks between Washington and Beijing, and reports of an upcoming meeting between President Trump and President Xi Jinping, signalled easing geopolitical risk. Trump’s comment that he expected “a very fair deal” encouraged risk-taking, diverting flows toward equities.
Seasonal factors also played a role. The end of India’s Diwali festival, traditionally a high-demand period for physical gold, brought a brief lull in buying from one of the world’s largest consumers. Combined with futures market unwinding, this compounded the downward pressure.
Gold technical insights
Despite the volatility, gold remains within a broader uptrend. The metal continues to respect its rising trendline on the daily chart, which has supported every major pullback this year. After retreating from highs above $4,300, prices are now testing support near $4,100–$4,120.
Candlestick patterns show rejection wicks at these levels—indicating that buyers are defending the trendline. Momentum has cooled, with RSI now near 58, suggesting the market is no longer overheated but still maintains positive bias.
As long as the RSI stays above 50 and the trendline holds, analysts expect gold to retest the $4,300–$4,360 region. However, a daily close below the trendline could open the door for a deeper pullback toward $4,000.
Bias: Bullish above $4,100 toward $4,360 resistance level; neutral-to-bearish if price breaks below the trendline.

The rarity of the move
A 4.5-sigma move like this is statistically extraordinary - something expected only once every 240,000 trading days. Since 1971, gold has seen such declines just 34 times out of more than 13,000 sessions - barely 0.26% of the time, according to Burggraben Holdings.
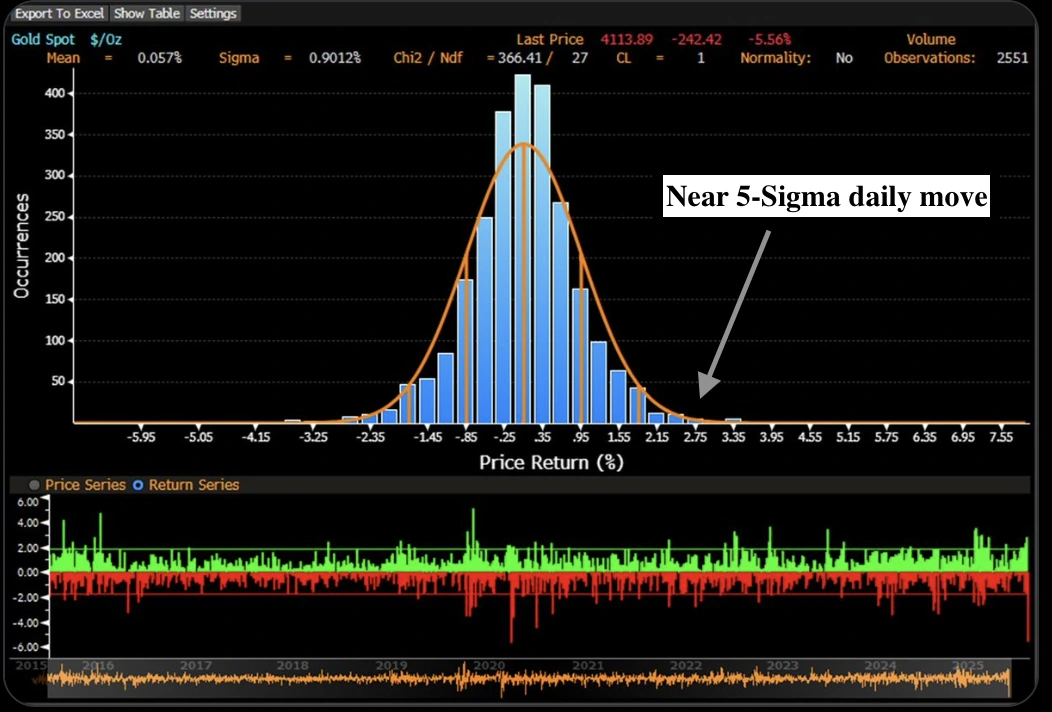
This means October’s crash ranks among the rarest events in the metal’s modern history. Ironically, it arrived at a moment of peak optimism - right after gold’s most powerful rally since the 1970s bull market.
Why fundamentals remain strong
Despite the setback, gold’s macro and structural fundamentals remain supportive of long-term strength.
Inflation remains sticky
Alternative indicators show U.S. inflation climbing to 2.6%, marking a fifth straight monthly rise despite delays in official government data.
Rate cuts are priced in
Markets expect the Federal Reserve to deliver a 25-basis-point cut at its next meeting. Lower rates weaken the dollar and favour non-yielding assets like gold.
Central banks keep buying
Sovereign demand remains steady. Central banks have been accumulating gold reserves throughout 2025 to diversify away from the dollar, with no sign of slowing even after the price dip.
Institutional demand remains robust
Major funds and ETFs continue to see inflows, suggesting long-term investors are using this pullback as an opportunity to accumulate positions rather than exit.
Geopolitical risks linger
Despite calmer trade rhetoric, broader uncertainties - especially involving the U.S., China, and Russia - continue to shape investor sentiment, keeping safe-haven demand alive.
Market outlook: volatility before recovery
After reaching $4,381, gold has pulled back to the $4,000 area, where it is testing support levels once again. Traders on Deriv MT5 can monitor these zones live and assess risk exposure with real-time chart tools.
Citigroup recently shifted its stance from overweight to neutral, citing overcrowded positions, but expects a stabilisation phase near $4,000. Meanwhile, Saxo Bank’s Ole Hansen describes the drop as “a necessary cooldown,” arguing that the drivers of gold’s rally remain firmly in place.
ING analysts concur, calling the selloff “largely technical” and predicting renewed momentum once markets absorb the profit-taking wave.
Silver remains more volatile but resilient - down 9% on the day yet still up 67% YTD. Given its dual industrial and investment roles, analysts expect it to rebound faster.
Gold price prediction 2025
Short-term strategy
Volatility is set to remain high. Watch for price consolidation between $4,000–$4,050 as a potential accumulation zone. Traders can use Deriv’s Trading Calculator to estimate position sizes, margin, and risk before entering trades.
Medium-term outlook
The broader trend remains constructive. Sticky inflation, central bank buying, and expected rate cuts all point toward renewed upward momentum once the market stabilises.
Silver exposure
Silver’s sharper decline may appeal to traders comfortable with volatility. Historically, silver tends to outperform gold during recoveries, offering higher percentage gains once sentiment turns positive.
For now, this “historic crash” looks less like a turning point and more like a mid-cycle pause - a consolidation phase before gold resumes its push toward new highs.
إخلاء مسؤولية:
The performance figures quoted are not a guarantee of future performance.
الأسئلة الشائعة
Why did gold price crash so suddenly?
Does this mean the bull run is over?
How rare is a move like this?
What role did silver play in the selloff?
What could push gold back toward $4,200 and beyond?


