المحتويات
مقال
Analysis: What’s driving the parallel upswing in Gold prices and US shares?
November 11, 2025
مقال
Analysis: What’s driving the parallel upswing in Gold prices and US shares?
November 11, 2025
مقال
Analysis: What’s driving the parallel upswing in Gold prices and US shares?
November 11, 2025
The simultaneous rally in gold and U.S. stocks is unusual, given that gold typically thrives during periods of uncertainty, while equities tend to rise on economic optimism. Analysts say a mix of factors is fuelling both markets at once.
Markets price in a 67% chance of a 25-basis-point reduction in December, climbing to around 80% by January, according to CME’s FedWatch tool.
That single expectation - cheaper money - is driving two assets that usually pull in opposite directions: gold, the long-standing safe haven, and equities, the traditional risk trade. With economic data showing signs of fatigue and fiscal tensions building, traders are positioning for a looser policy stance that supports both defensive and growth assets simultaneously.
Key takeaways
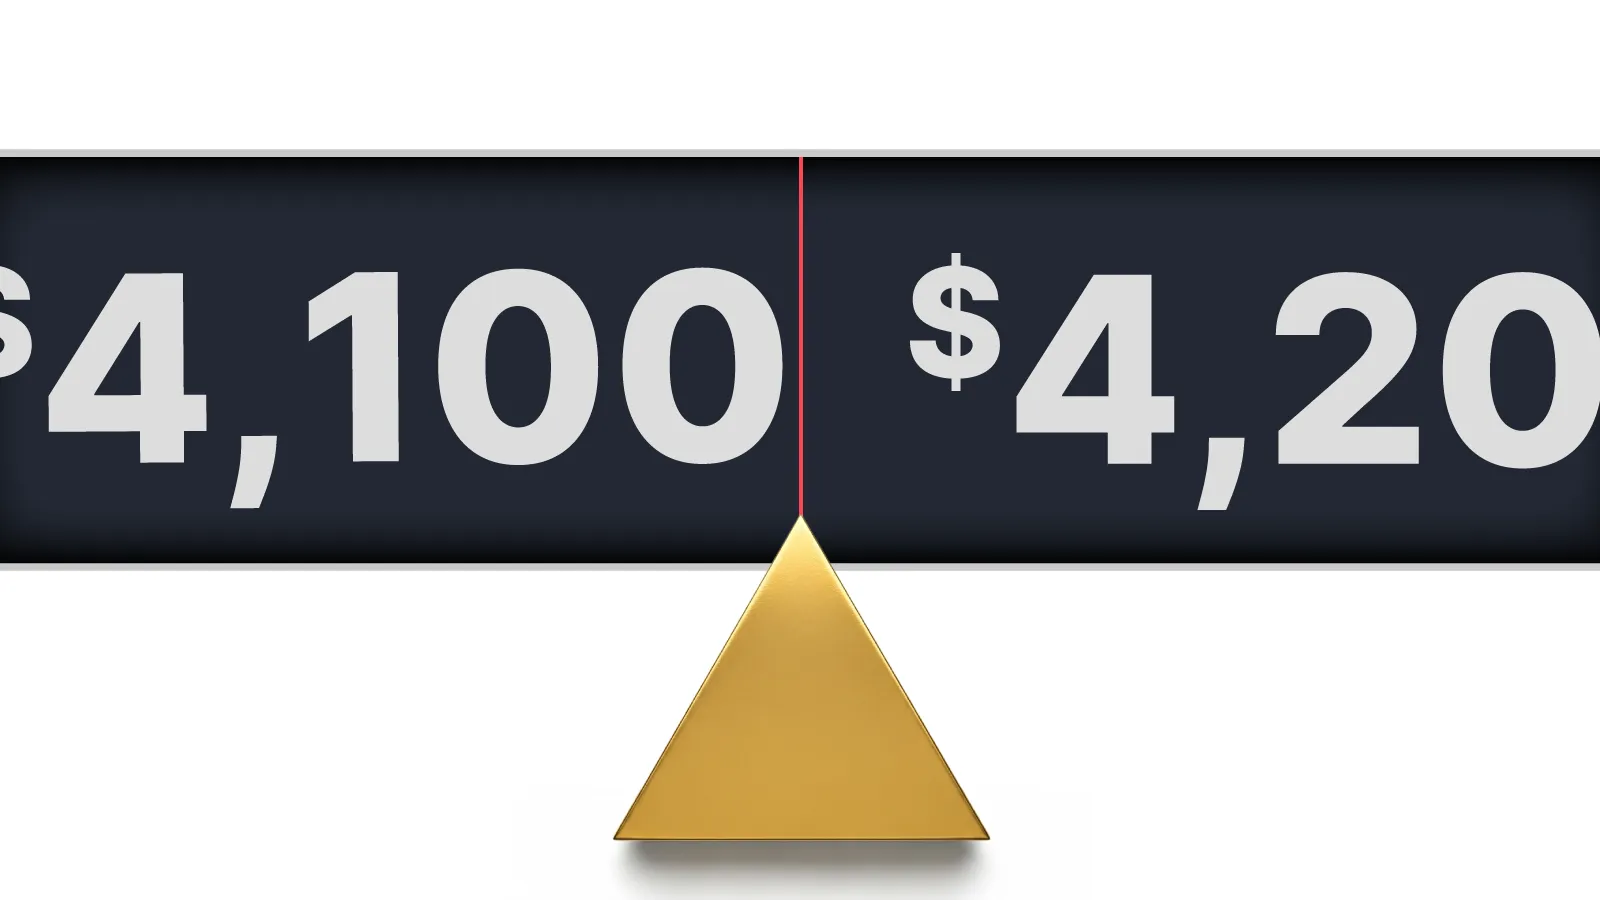
- Gold holds above $4,100 per ounce, its highest in two weeks, as investors anticipate monetary easing.
- US equities are rising on expectations of lower borrowing costs and stronger forward earnings multiples.
- The move reflects confidence in liquidity, not genuine economic acceleration.
- Fiscal anxiety and higher Treasury yields provide a second layer of support for gold.
- Persistent physical demand from India and central banks continues to anchor prices.
Fed rate cut calls drive gold and US stocks
The current rally is rooted in a decisive shift in market expectations. Recent US data - weaker private employment, declines in government and retail jobs, and subdued consumer sentiment - has convinced investors that the Fed will turn dovish in December.
Lower rates affect both sides of the market:
- Equities benefit as cheaper financing boosts valuations and corporate margins.
- Gold gains appeal as the cost of holding non-yielding assets falls.
This alignment has created a synchronised uptrend, where optimism about liquidity overrides traditional distinctions between safe and risky assets. On Deriv MT5, traders can watch this dynamic unfold live - with metals and indices responding in tandem to shifts in rate-cut probability.
US fiscal policy re-emerges as a hidden driver
The US government shutdown and its temporary resolution have thrown fiscal fragility back into focus. The Senate’s bipartisan agreement - backed by President Donald Trump - eased short-term disruption but drew attention to the United States’ growing debt burden.
As Saxo Bank’s Ole Hansen noted, “Rising yields driven by fiscal anxiety, rather than economic strength, have historically been supportive for investment metals.”
In this sense, higher yields are a warning signal, not a sign of economic vitality.
With federal agencies resuming normal operations, markets will soon receive a backlog of economic data, likely confirming that growth momentum is fading and reinforcing the case for policy easing.
Gold and stocks: A rare tandem surge in the markets
Gold and equities have traditionally represented opposing market moods - fear versus optimism. Yet in 2025, they are rallying together on liquidity expectations.
Whenever investors anticipate cheaper credit, all assets tied to the cost of capital - such as gold and high-growth technology shares - tend to advance in unison. This represents a structural change in market behaviour: policy expectations have overtaken fundamentals as the dominant driver of price movement.
Gold’s ability to strengthen despite a firm US dollar further underlines this point. Central-bank guidance, rather than currency fluctuations, is now the primary influence on cross-asset performance.
Physical gold demand adds depth to the rally
Behind the speculative surge lies solid physical demand. In India, the appetite for gold remains robust:
- Gold ETF inflows totalled $2.9 billion in the first ten months of 2025 - around 26 tonnes, almost matching cumulative inflows from 2020–2024.
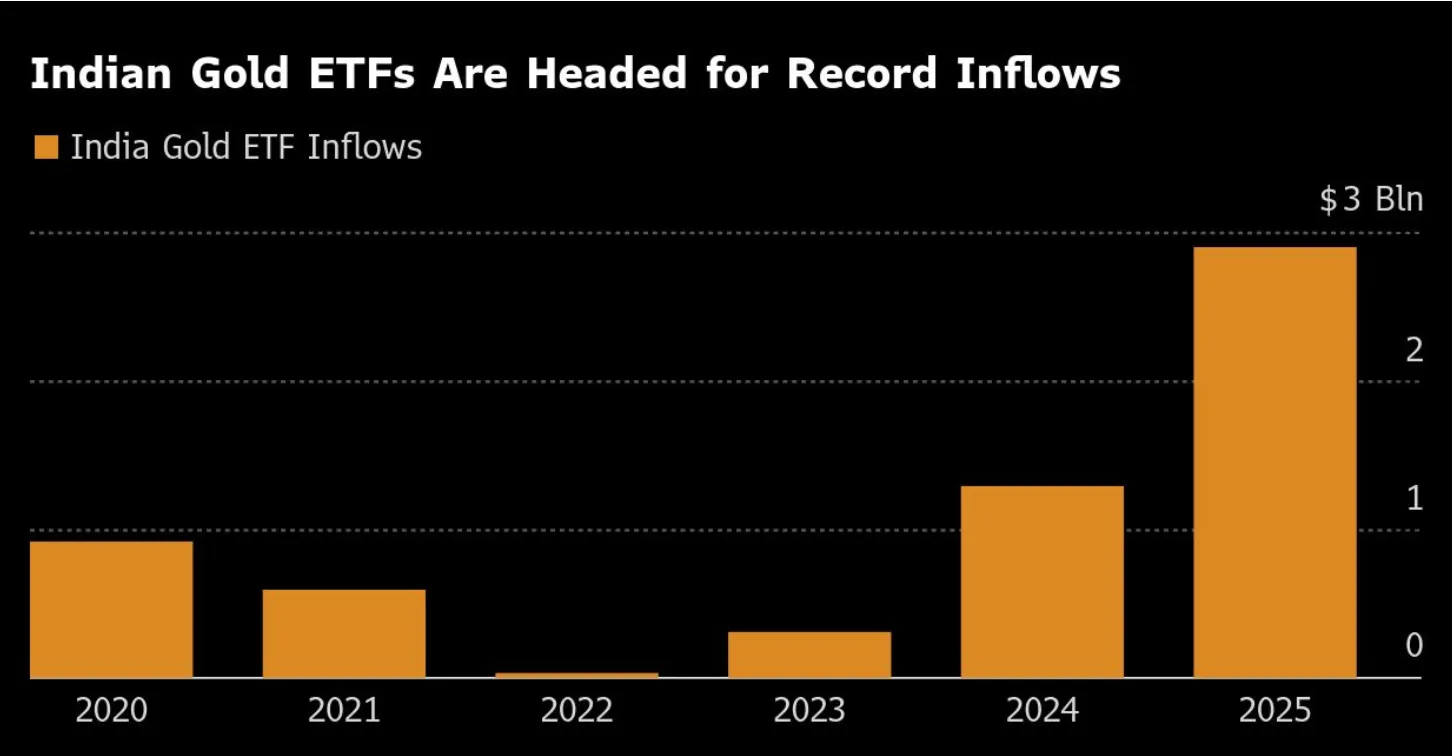
- October alone brought $850 million in new inflows, following a record $942 million in September.
- Total Indian ETF holdings now exceed 83.5 tonnes, valued at over $11 billion.
These figures show that the rally is not purely speculative. Real-world accumulation by households, institutions, and central banks continues to provide a structural floor under prices. Traders on Deriv MT5 can track these global flows alongside live charts to gauge the staying power of current trends.
Gold miners mirror investor confidence
The corporate side of the gold market echoes this optimism. Barrick Gold (ABX.TO), one of the world’s leading producers, posted stronger-than-expected quarterly profits, raised its dividend by 25%, and authorised a $500 million share buy-back.
- Average realised price: $3,457 per ounce, up from $2,494 a year earlier.
- Output slipped from 943,000 to 829,000 ounces, with all-in sustaining costs rising modestly to $1,538 per ounce.
Barrick’s strategic tilt towards North American operations suggests confidence that high prices will endure. Yet its continuing Mali dispute - which involved a $1 billion write-off and the detention of employees - underscores the geopolitical fragility of global gold supply, a factor that could keep the market tight into 2026.
Macro backdrop: debt, yields, and the policy paradox
Gold’s more than 50% gain this year speaks less to inflation fears and more to the market’s growing dependence on fiscal and monetary intervention.
Rising US Treasury yields are no longer a sign of confidence in growth, but rather a reflection of concern about debt sustainability. Investors are simultaneously buying gold as a hedge and equities for liquidity exposure - a dual strategy that captures the essence of today’s policy-driven markets.
Gold and US stock scenarios for the months ahead
Bullish breakout
If the Fed confirms a December cut and signals further easing, gold could move beyond $4,200, supported by persistent fiscal concerns and central-bank demand.
Short-term consolidation
If policymakers hesitate, gold may consolidate between $4,050 and $4,150, while equities continue their gradual ascent until liquidity expectations fade.
In both cases, the critical variable is the same - the price of money, not traditional risk sentiment.
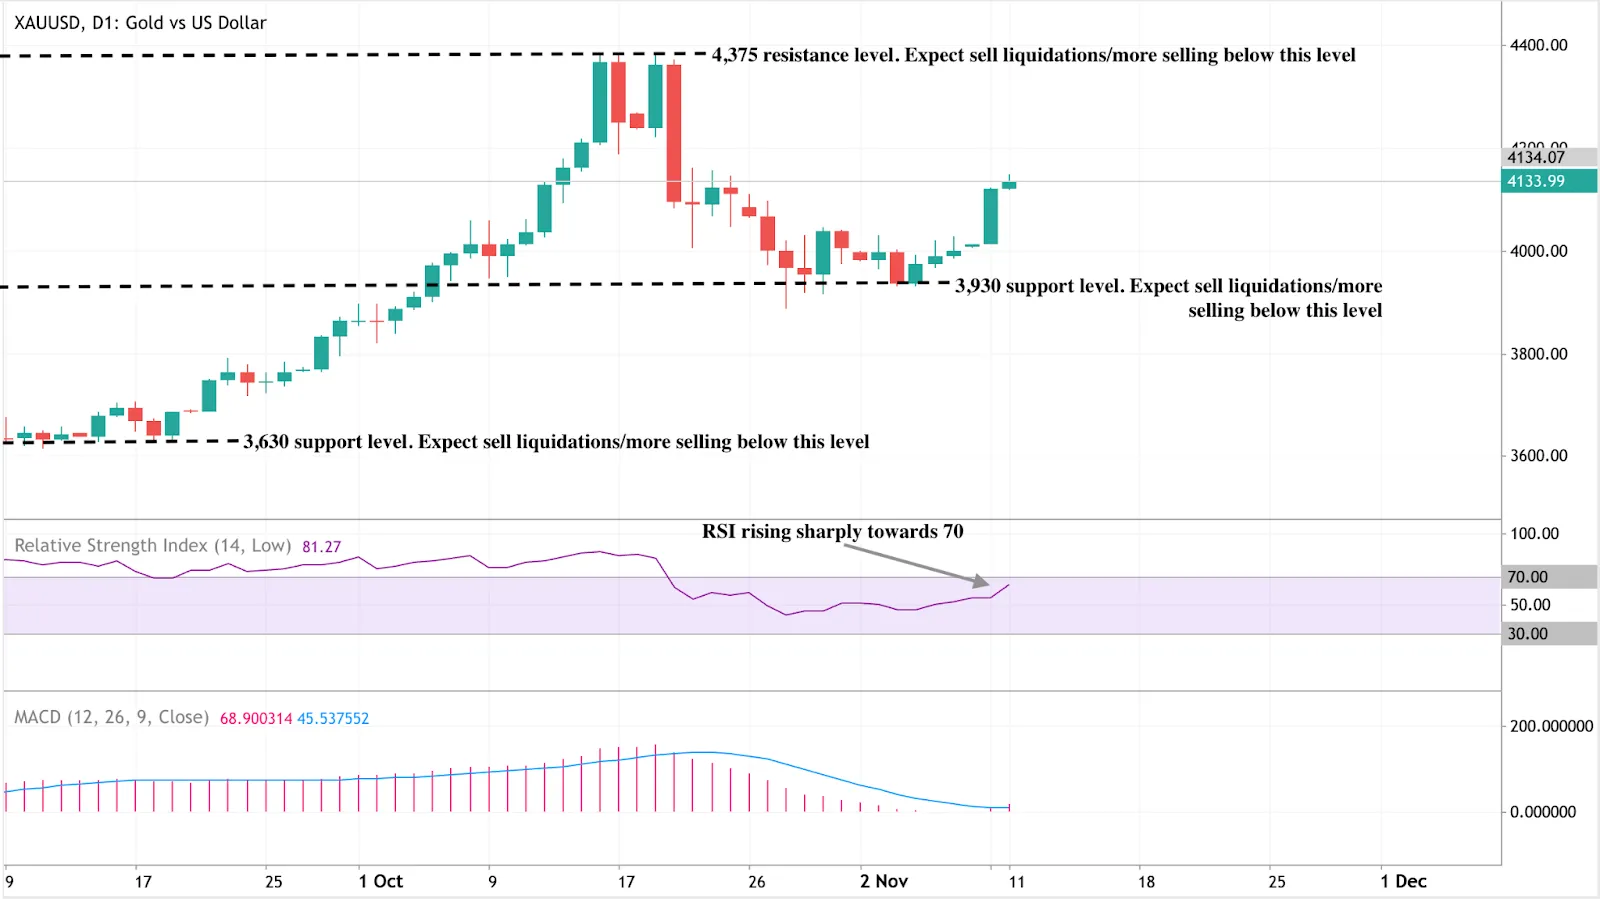
Gold technical insights
Gold (XAU/USD) is trading near $4,134, consolidating between resistance at $4,375 and support at $3,930.
- The RSI indicates strong upward momentum but suggests overbought conditions, suggesting a potential pause.
- The MACD remains in a bullish crossover, confirming continued buying interest.
- A breakout above $4,375 could extend gains, while a slide below $3,930 might expose support near $3,630.
Traders can monitor these technical levels via Deriv MT5 and use the Deriv Trading Calculator to model margin, contract size, and potential exposure before placing trades.
Gold investment outlook
- Short-term traders: Watch the $4,100–$4,200 range closely ahead of the Fed’s December meeting. Confirmation of a rate cut could open the door to further upside.
- Medium-term investors: Fiscal pressures, volatile real yields, and robust Asian demand remain the primary supports for gold.
- Portfolio managers: Gold’s changing correlation with equities indicates that it now behaves as a policy-sensitive parallel asset, necessitating a new approach to portfolio diversification.
إخلاء مسؤولية:
The performance figures quoted are not a guarantee of future performance.
الأسئلة الشائعة
How does US fiscal stress influence gold prices?
What impact does India’s demand have?
Are gold miners benefiting from elevated prices?
Could gold retreat if the Fed delays cuts?
How can I trade gold and US indices together on Deriv?


