المحتويات
مقال
NFP data highlights a cooling US labour market: What comes next?
December 17, 2025
مقال
NFP data highlights a cooling US labour market: What comes next?
December 17, 2025
مقال
NFP data highlights a cooling US labour market: What comes next?
December 17, 2025

What comes next is a transition rather than a turning point. November’s Non-Farm Payrolls report showed the US economy added 64,000 jobs, slightly ahead of expectations, while the unemployment rate rose to 4.6%, its highest reading since 2021. Employment growth remains intact, but the pace that characterised the post-pandemic rebound is steadily losing momentum, reports suggest.
That shift is reshaping market thinking. Analysts note that a labour market that is cooling without tipping into stress reduces inflation risks while keeping the broader economy on stable footing. For the Federal Reserve, this creates more room to adjust policy carefully. Recent reports suggest that investors are now less focused on whether the slowdown is happening and more concerned with the timing and scale of any policy response.
What’s driving the labour market slowdown?
The softer signal in November’s NFP report points to gradual deceleration rather than abrupt weakness. While headline job growth stayed positive, revisions to previous months altered the broader picture. September payrolls were revised lower by 33,000, and October recorded a loss of 105,000 jobs, partly reflecting distortions caused by the recent US government shutdown.
Wage data further supports the cooling narrative. Average hourly earnings increased by just 0.1% month-on-month, falling short of forecasts, while annual wage growth slowed to 3.5% from 3.7%. This easing in wage momentum suggests labour demand is softening without triggering widespread job losses.
That distinction is critical for policymakers. A slowdown driven by moderating wages and slower hiring, rather than rising unemployment claims, aligns closely with the Federal Reserve’s goal of easing inflation pressures without derailing economic growth.
Why it matters
For the Federal Reserve, November’s NFP report restores a clearer view of labour market conditions after weeks of uncertainty linked to shutdown-related disruptions. Fed officials, including New York Fed President John Williams, have consistently highlighted signs that labour market tightness is gradually easing, and the latest data broadly confirms that assessment.
Markets have adjusted their expectations accordingly. Futures pricing now reflects around 58 basis points of rate cuts in 2026, well above the more cautious signals from the Fed’s latest projections. Analysts at Sucden Financial described the data as “consistent with a controlled slowdown rather than an outright contraction,” reinforcing the idea that policy easing can proceed without urgency.
Impact on markets and assets
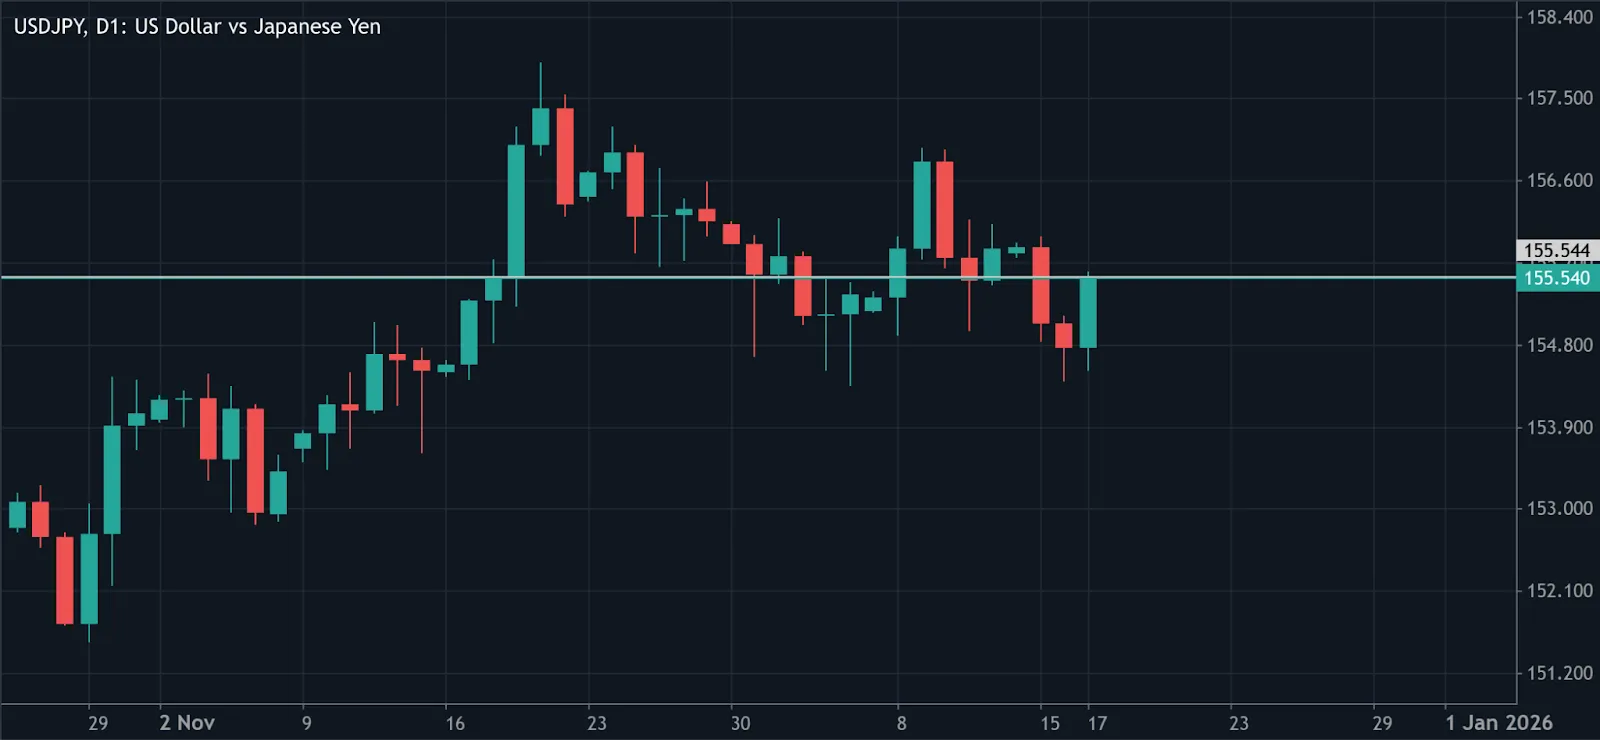
Market reactions were muted on the surface, but underlying shifts were notable. US equities edged lower as investors reassessed growth prospects, while the US dollar softened against most major currencies. USD/JPY initially slipped towards the 154.6 level as weaker US data weighed on the dollar, before rebounding above 155 as traders balanced Fed expectations against the prospect of tighter policy in Japan.
Commodities reflected a similar recalibration. Copper prices eased despite remaining more than 30% higher for the year, with thin year-end liquidity amplifying price moves as investors trimmed positions. Oil prices fell towards $55 a barrel, pressured by optimism around potential progress in Russia-Ukraine peace talks and rising concerns about a supply surplus in 2026 as global demand indicators soften.
Expert outlook
Looking ahead, economists broadly expect the labour market to continue cooling into early 2026 rather than re-accelerate. Inflation trends support this view, reinforcing expectations that price pressures will continue to ease as wage growth slows and hiring moderates.
History provides a useful reference. During the Federal Reserve’s 2019 easing cycle, the dollar index initially strengthened before weakening in the months following the first rate cut as markets adjusted to a lower-rate environment.
With another NFP report due in early January, just ahead of the Fed’s next meeting, investors will be watching for confirmation that November’s data marks the start of a sustained shift rather than a temporary pause.
Key takeaway
November’s NFP report confirms that the US labour market is cooling in a steady and controlled manner. Job creation is slowing, wage pressures are easing, and unemployment is edging higher without signalling economic distress. This backdrop supports the case for rate cuts later in 2026 and limits upside pressure on the US dollar. The next key signals will come from inflation data and Federal Reserve guidance as markets move into the new year.
USD/JPY technical insights
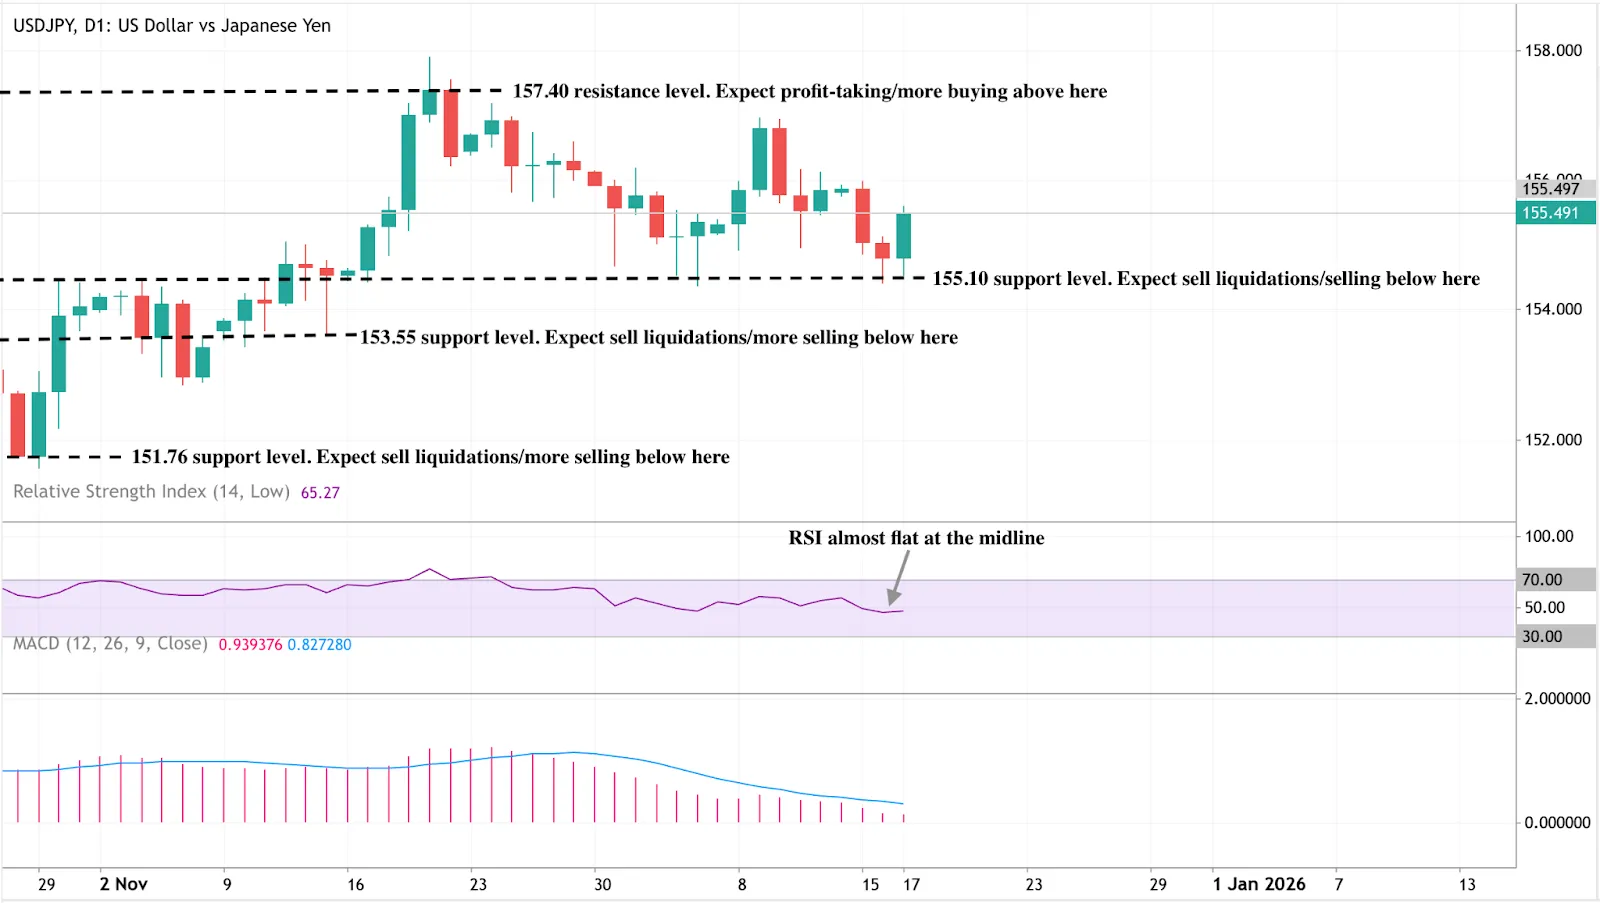
USD/JPY continues to consolidate just above the 155.10 support zone after failing to sustain gains near the 157.40 resistance, suggesting a pause in bullish momentum rather than a decisive trend reversal. Price action remains range-bound, reflecting the balance between softer US data and ongoing uncertainty around interest-rate divergence.
Momentum indicators point to a neutral near-term bias. The RSI is hovering close to the 50 level, indicating limited directional conviction, while the MACD remains slightly positive but is flattening, a sign that upside momentum is fading. Traders are closely monitoring whether the pair can hold above key support levels as volatility risks increase around central bank events.
As long as 155.10 holds, the broader bullish structure remains intact. A clear break below this level could expose downside towards 153.55 and potentially 151.76. On the upside, a sustained move back above 157.40 would be required to restore momentum and shift the technical outlook back in favour of the bulls.
إخلاء مسؤولية:
The performance figures quoted are not a guarantee of future performance.
الأسئلة الشائعة
What is the Non-Farm Payrolls report?
Why did unemployment rise even though jobs were added?
How does NFP data affect the US dollar?
Does this data point to a recession?
What should markets watch next?


