المحتويات
مقال
Gold’s November breakout: Can the rally to $4,300 hold its shine?
November 25, 2025
مقال
Gold’s November breakout: Can the rally to $4,300 hold its shine?
November 25, 2025
مقال
Gold’s November breakout: Can the rally to $4,300 hold its shine?
November 25, 2025

Picture this: you roll over, check your phone, and see “Gold Breaks Past $4,300” splashed across financial headlines. Sounds unreal? That’s been the October reality - and November hasn’t cooled off either. As of 25 November 2025, gold remains at a record high near $4,132 per ounce, maintaining its momentum.
If you’ve been wondering whether gold’s glitter still makes sense in your portfolio, now’s the time to dig deeper. Let’s unpack the numbers, the charts, and the sentiment - minus the noise.
Why is gold climbing so sharply in late 2025?
Gold’s latest leap isn’t just luck. On 24 November, prices broke above $4,100 per ounce, rising 1.65% in a single day. Behind the move? Growing bets that the U.S. Federal Reserve will ease rates sooner than expected, following softer inflation data.
Add in the ongoing Russia–Ukraine peace discussions, and investors have one more reason to seek shelter in safe-haven assets - especially as crude oil retreats on whispers of de-escalation.
Zooming out, central banks are on track to buy more than 900 tonnes of gold this year, surpassing demand from both the jewellery and tech sectors. That’s no small feat - it effectively puts a safety net under prices, signalling that institutional buyers are still using gold as an anchor against currency and market swings.
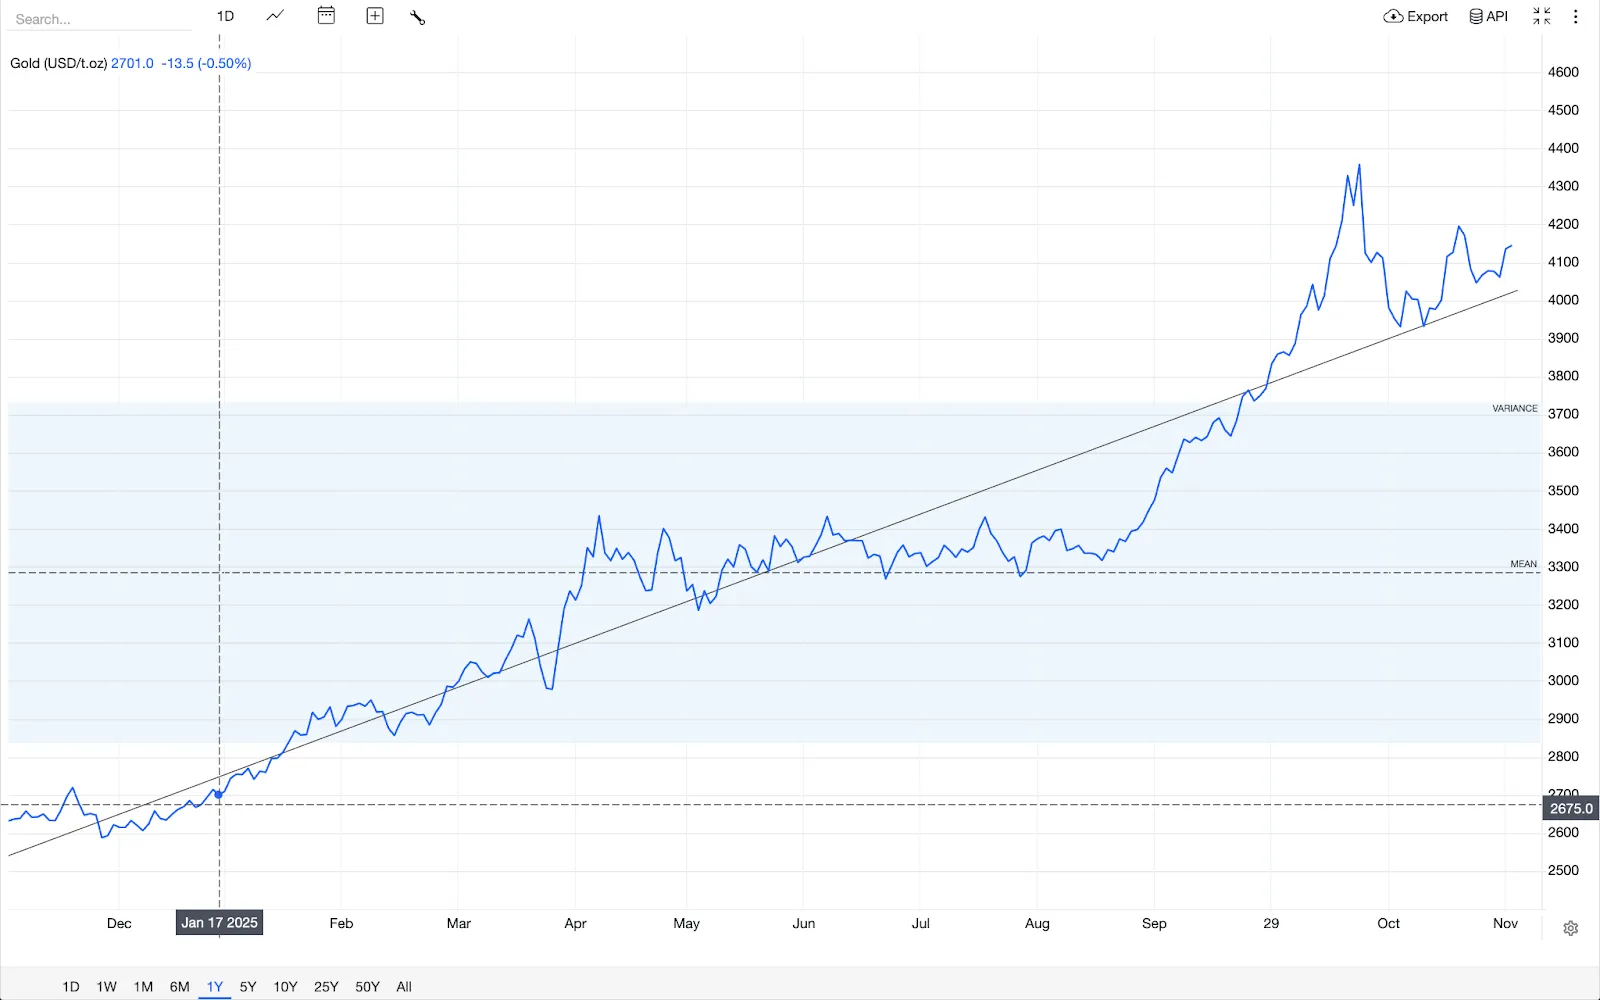
For individual investors, this rally serves as a gentle nudge: with gold up 58% year-to-date (from around $2,600 in January), now’s the moment to reassess how it fits into your risk mix.
How close is gold to its historic peaks, and what do the charts say?
The latest all-time high? $4,379.13, set on 17 October 2025 - a level that comfortably outshines the inflation-adjusted 1980 peak of roughly $3,400 (then $850 nominally).
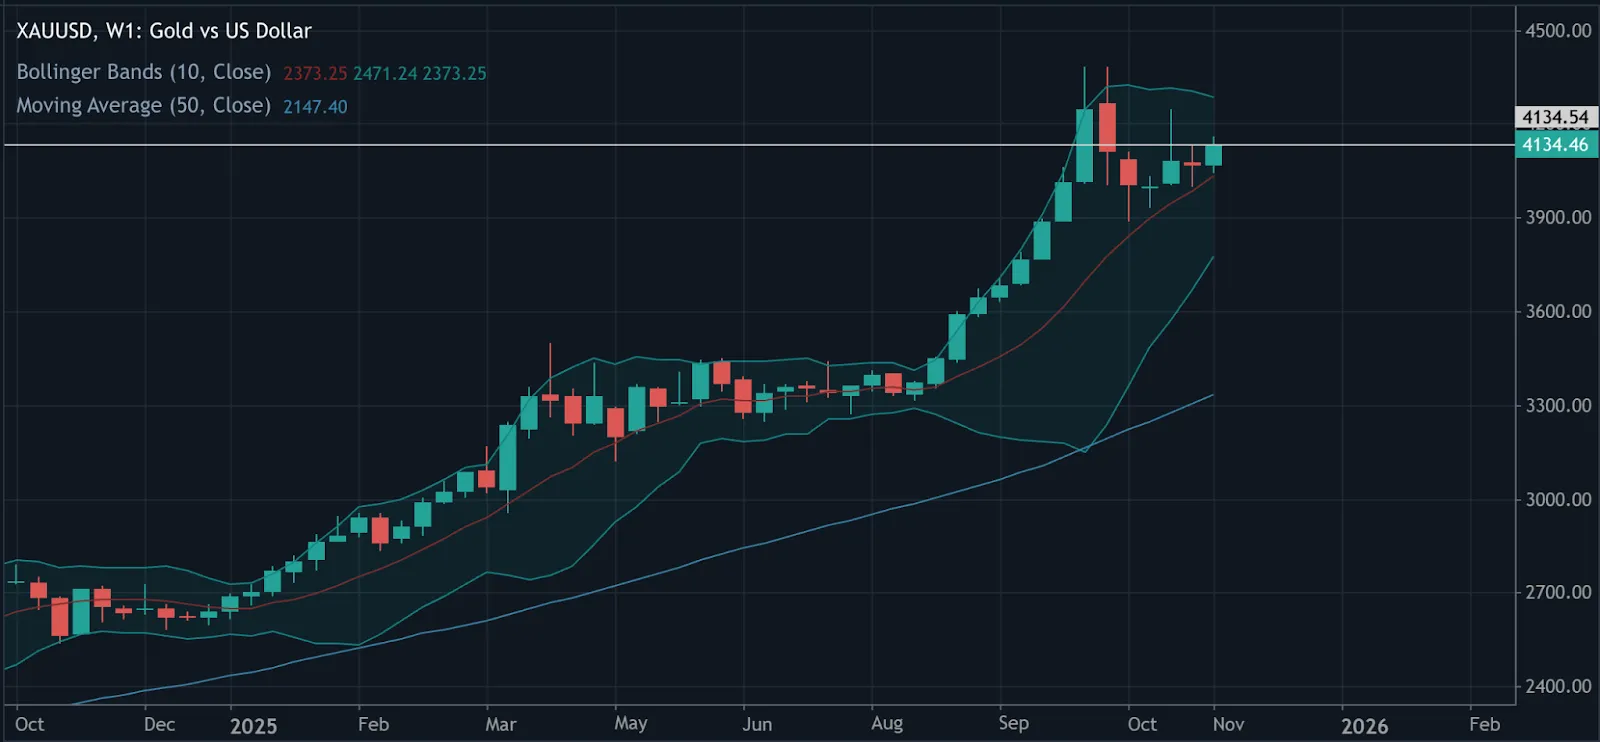
By late November, gold had been consolidating between $4,046 and $4,145, forming a bull pennant on daily charts - a structure often seen before another breakout. Short-term charts show gold clinging to its 50-period moving average near $4,010, while resistance looms at $4,108. On the weekly timeframe, it’s pressing against the upper Bollinger Band after a 3.7% monthly gain.
Historically, these tight consolidations tend to precede either a 10–15% correction or a renewed surge. It’s a reminder that gold, even when near its highs, can still act as both an inflation shield and a steady long-term holding - particularly in retirement or diversified portfolios.
Expert take:
“Gold’s resilience stems from its inverse correlation to real yields,” explains Yoav Niv, analyst at FX Empire. “Even modest shifts in yield expectations have been enough to keep gold supported.”
Actionable angle: If this week’s inflation readings continue easing real yields, gold could test the $4,300–$4,379 zone again - worth monitoring for those balancing exposure between bonds, cash, and commodities.
Gold’s role in everyday portfolios
Consider this: a mid-40s couple in Chicago, weary from 7% inflation in 2024, decided to park 5% of their savings into a gold ETF early this year. By November, that allocation had surged 58%, helping them cushion rising living costs without adding riskier assets.
Or take the example of a small jewellery manufacturer that hedged gold prices at $4,000, softening the blow from a strengthening dollar. These aren’t flashy trading stories - they’re practical lessons in how gold smooths volatility in real-world finances.
If currency moves or import prices are eating into your costs, a modest gold allocation through ETFs or similar instruments can act as a stabiliser. The point isn’t to chase momentum - it’s to diversify smartly.
November’s rally reaffirms gold’s timeless role: a financial shock absorber when uncertainty runs high. Whether analysing historic peaks or short-term pullbacks, the message is clear - gold works best when it’s part of a balanced plan, not a gamble.
Gold technical insights
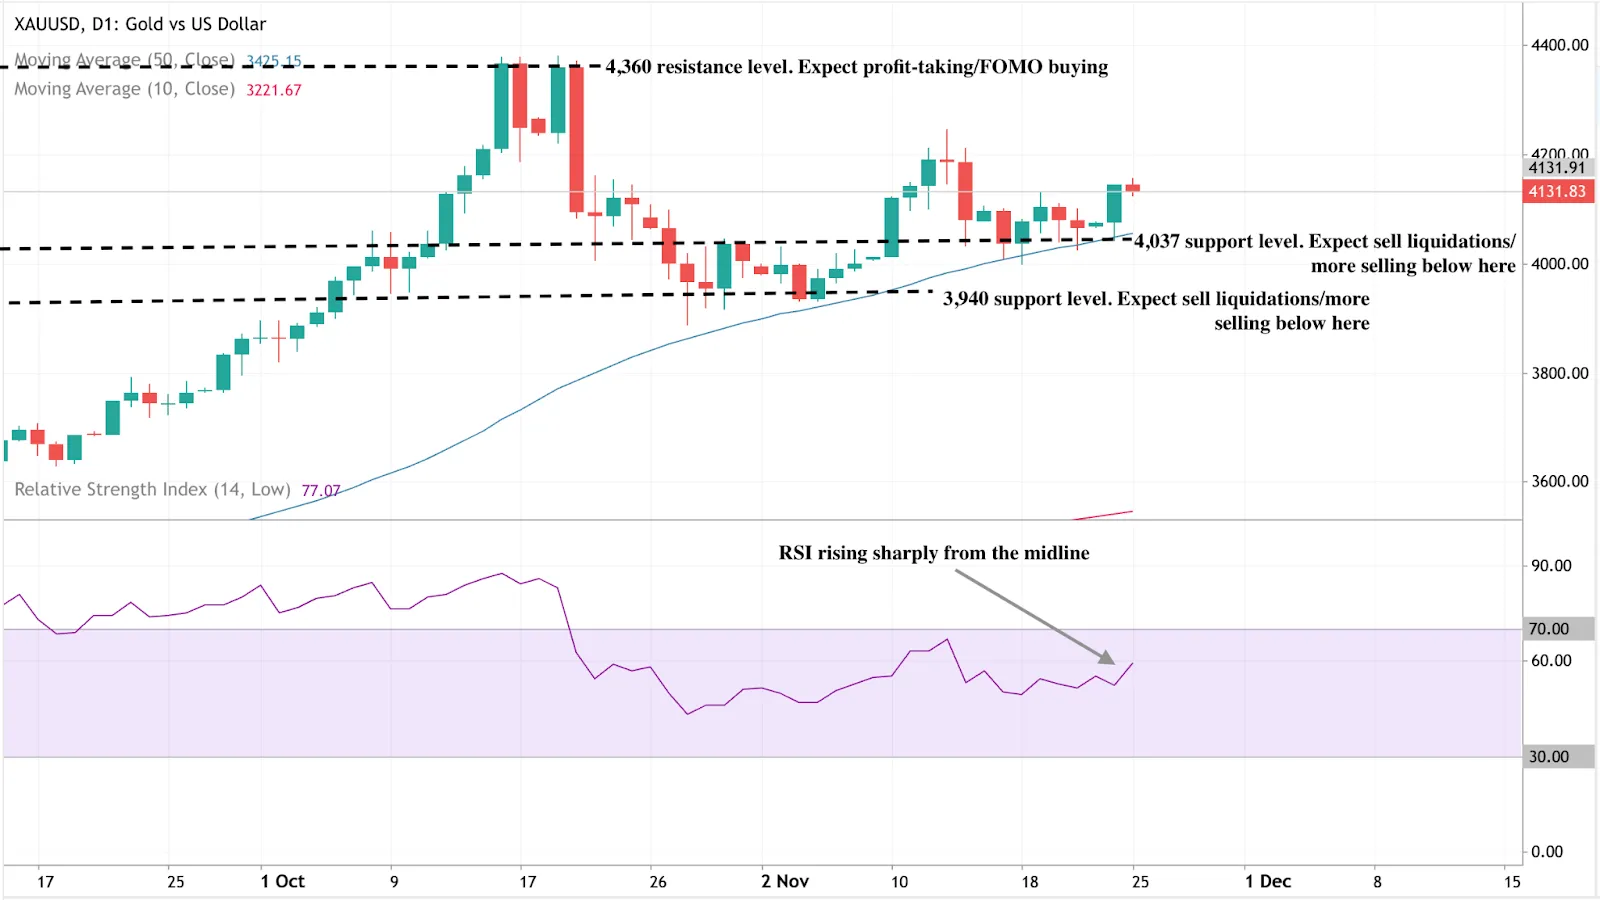
At the time of writing, XAU/USD is holding firm near $4,132, with buyers comfortably defending key supports at $4,037 and $3,940. Staying above these levels keeps the bullish bias intact - but a slip beneath could invite quick profit-taking.
Overhead, $4,360 remains a critical resistance point, likely to attract both profit-takers and new momentum buyers. The RSI sits around 77, signalling strong upward momentum, though short-term traders should watch for overbought pullbacks before the next leg higher.
إخلاء مسؤولية:
The performance figures quoted are not a guarantee of future performance.
الأسئلة الشائعة
Is gold still a reliable hedge against inflation?
What’s the short-term outlook for gold prices?


