المحتويات
مقال
Silver overtakes Nvidia as turbulence defines a historic rally
December 29, 2025
مقال
Silver overtakes Nvidia as turbulence defines a historic rally
December 29, 2025
مقال
Silver overtakes Nvidia as turbulence defines a historic rally
December 29, 2025
%20(1).webp)
Silver has never been a calm market, but its latest surge has reshaped the global asset hierarchy. Prices are up more than 185% year-to-date, briefly climbing above $84 an ounce and lifting silver’s estimated market value to around $4.65 trillion. That move pushed the metal past Nvidia, making silver the world’s second-largest asset by valuation. It also marks silver’s strongest yearly performance since 1979, a period remembered for inflation shocks and extreme commodity cycles.
The rally quickly gave way to sharp turbulence. Within just over an hour of futures reopening, silver prices plunged nearly 10%, before finding tentative support near $75. Those violent swings have reignited a familiar debate: Is silver being repriced for a world of tighter supply, or is it entering a late-stage rally where leverage magnifies every shift in sentiment?
What’s driving Silver’s historic surge?
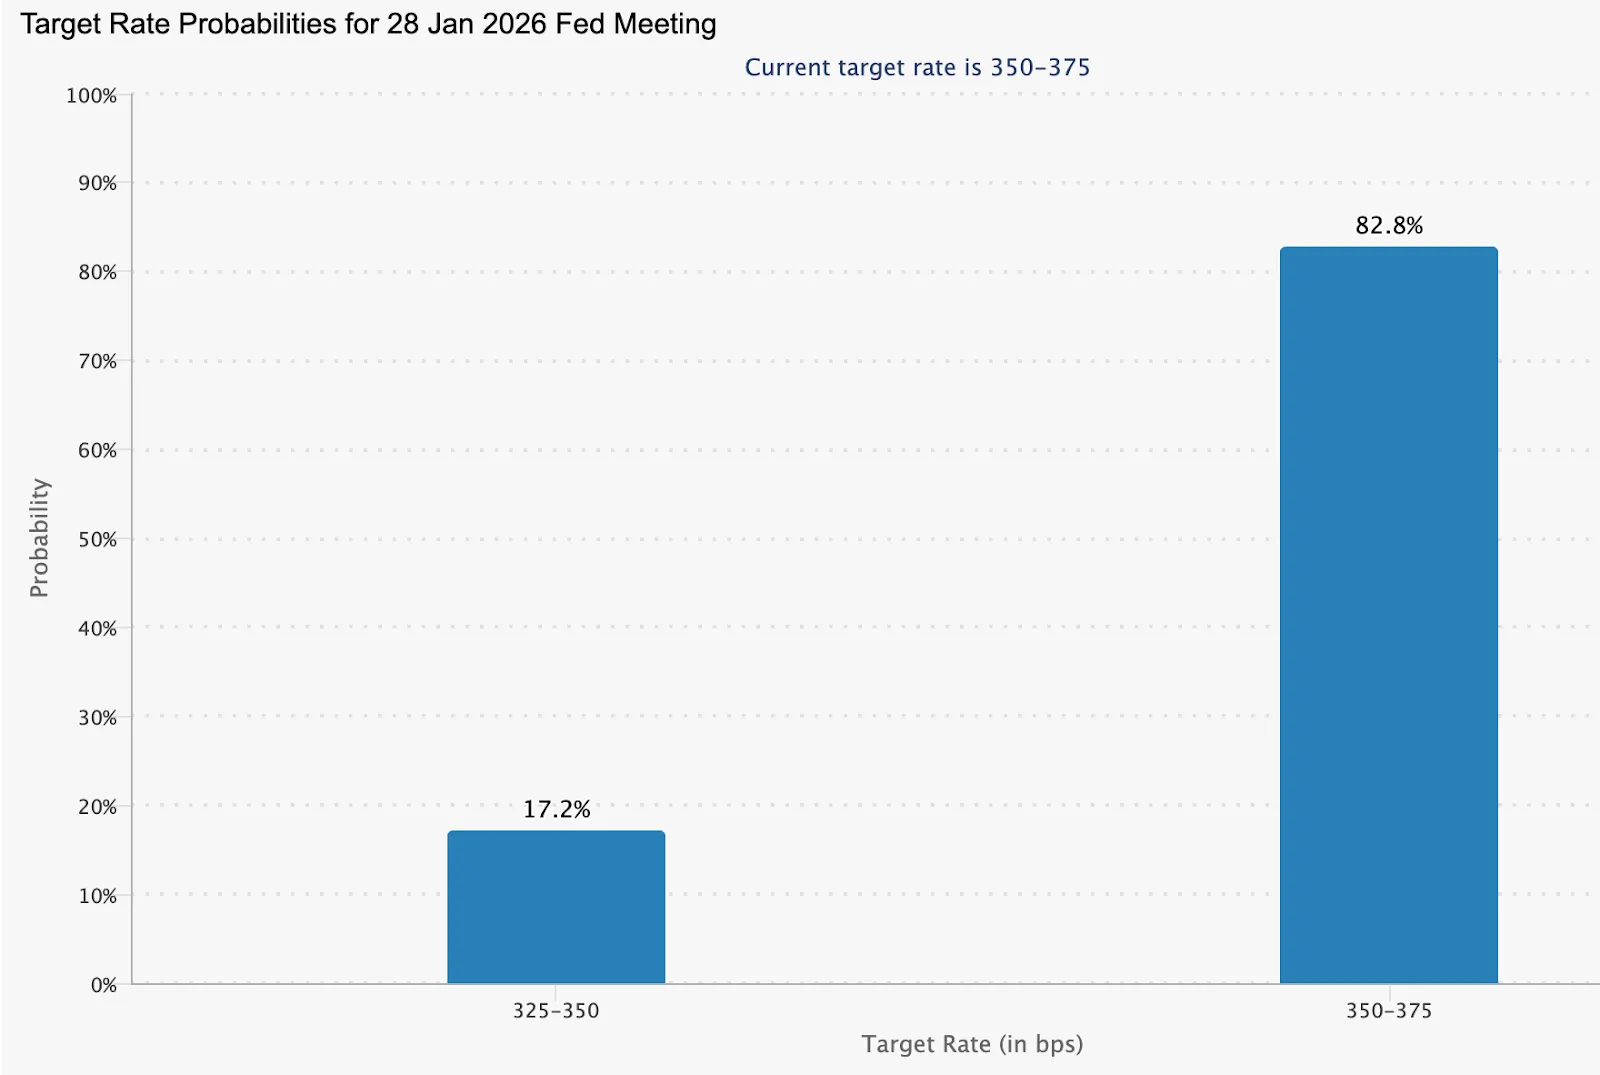
Silver’s breakout reflects more than speculative enthusiasm. Expectations that the US Federal Reserve will deliver deeper rate cuts in 2026 have revived demand for hard assets, though the CME FedWatch tool shows an 82.8% probability of rates remaining unchanged at the next January meeting.
As real yields compress, precious metals have benefited, with silver outperforming due to its dual role as both an investment hedge and an essential industrial material.
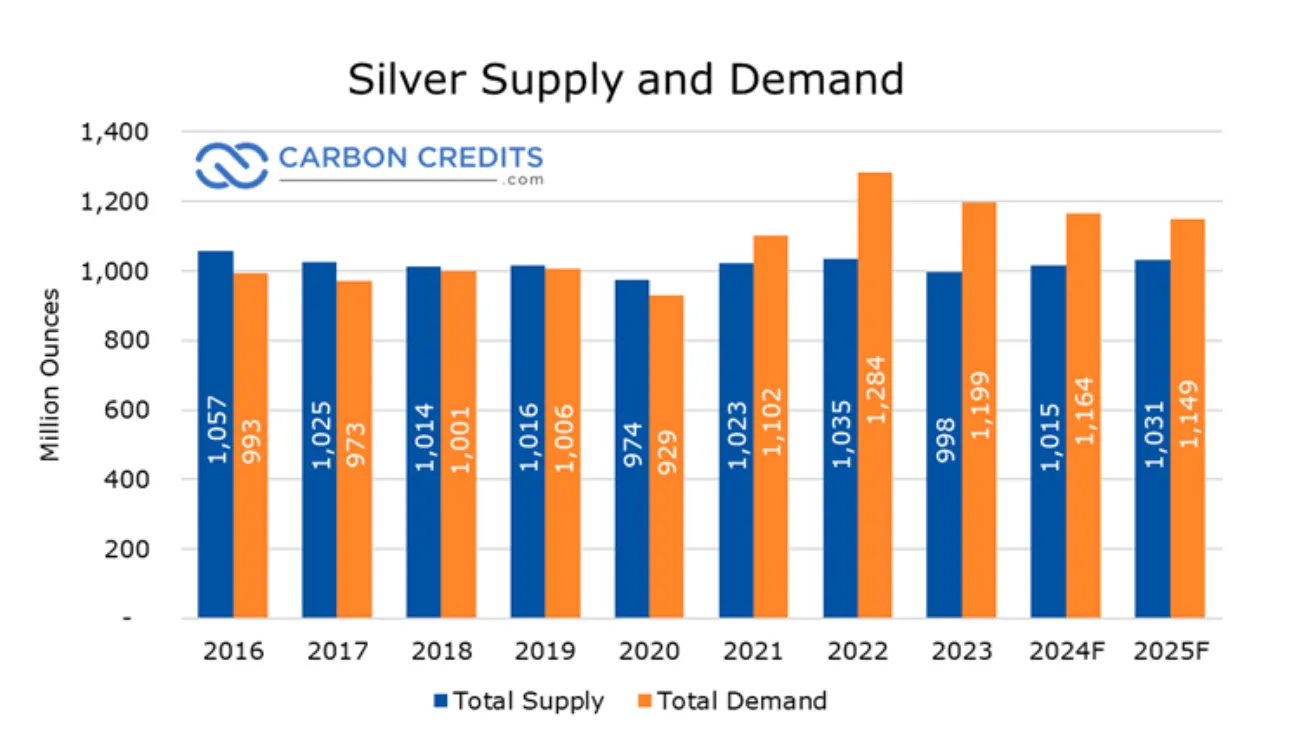
That monetary backdrop has collided with a supply-demand imbalance that has been years in the making. 2025 is expected to be the fifth straight year in which global silver demand outpaces supply, reinforcing the view that shortages are no longer cyclical.
Global demand is estimated at nearly 1.12 billion ounces, compared with a supply of around 1.03 billion ounces, resulting in an annual deficit of approximately 95 million ounces. Since 2021, cumulative shortfalls are estimated at approximately 800 million ounces, equivalent to nearly a full year of global mine output. The gap has been covered by steady inventory drawdowns, reducing the cushion that once absorbed demand shocks.
Supply growth has remained sluggish despite higher prices. Mine production in 2025 is projected at around 813 million ounces, largely unchanged from previous years.
About two-thirds of silver output is produced as a by-product of mining other metals, limiting producers’ ability to respond directly to silver price signals. Recycling has added little relief, with secondary supply rising by roughly 1%, far short of offsetting ongoing deficits. As a result, tightening conditions are increasingly reflected in futures markets and inventories, heightening volatility when positioning shifts.
Policy developments have further intensified the rally. China has confirmed that, from 1 January 2026, silver exporters will require government licenses, effectively restricting exports to large, state-approved firms. With China accounting for an estimated 60–70% of global refined silver capacity, even limited export controls carry significant implications for physical availability. That policy risk has supported prices, while also increasing sensitivity to sudden changes in market confidence.
Why it matters
Silver’s surge carries consequences far beyond commodity markets. Unlike gold, silver plays a critical role in modern industrial supply chains, from electrification and solar energy to electric vehicles and data infrastructure. That dual role helps explain why rising prices have drawn concern from industrial leaders. Tesla CEO Elon Musk described the price spike as “not good,” pointing to silver’s importance across a wide range of manufacturing applications.
Market views remain sharply divided. Tony Sycamore, a market analyst at IG, has warned that a possible “generational bubble” could be forming as capital flows into precious metals amid genuine supply constraints. He argues that demand for physical silver risks becoming self-reinforcing, pushing prices beyond levels justified by near-term industrial usage.
That tension is critical. Silver sits at the crossroads of financial speculation and real-world production economics, meaning extreme price moves risk distorting both investor behaviour and industrial planning.
Impact on industry and markets
For manufacturers, persistently elevated prices pose clear challenges. Solar panel production now accounts for a substantial share of annual silver consumption, while electric vehicles require significantly more silver than traditional combustion engines. Analysts estimate that prices near $130 per ounce would materially compress margins in the solar industry, potentially slowing deployment just as renewable targets accelerate.
Financial markets face a different kind of strain. The Chicago Mercantile Exchange has announced its second silver margin increase in two weeks, raising initial margin requirements for March 2026 contracts to about $25,000. The move increases the cost of maintaining leveraged positions at a time when volatility remains elevated.
Historical precedents add to the caution. In 2011, a sequence of margin hikes coincided with silver’s peak near $50, triggering forced liquidations and a sharp decline. The 1980 rally ended even more abruptly, as regulatory action and aggressive rate hikes crushed a highly leveraged market. While current measures are less severe, analysts warn that even moderate deleveraging can overwhelm physical demand in the short term.
Expert outlook
The near-term outlook hinges on whether physical demand can counterbalance pressure from futures markets. COMEX inventories are reported to have declined by roughly 70% over the past five years, while domestic silver stocks in China sit near decade lows. Negative swap rates indicate that buyers are increasingly prioritising physical delivery over paper exposure.
Uncertainty remains high. Hedge fund rebalancing, upcoming changes to commodity indexes, and shifting geopolitical dynamics all contribute to the risk of sharp price swings. A sustained move below $75 could open the door to a deeper consolidation, while renewed stress in physical supply chains may quickly revive bullish momentum.
Silver now sits at a pivotal point where long-term scarcity meets short-term financial pressure. The coming sessions are likely to determine whether the rally evolves into a lasting structural repricing or gives way to a more pronounced correction.
Key takeaway
Silver’s climb past Nvidia reflects more than speculative enthusiasm. A multi-year supply deficit, shrinking inventories, and rising industrial demand have collided with leverage-heavy markets. Margin increases and geopolitical developments may trigger abrupt pullbacks, but the underlying scarcity narrative appears intact. Close attention to physical stock levels, policy signals from China, and futures positioning will be essential as silver navigates this critical phase.
Silver technical outlook
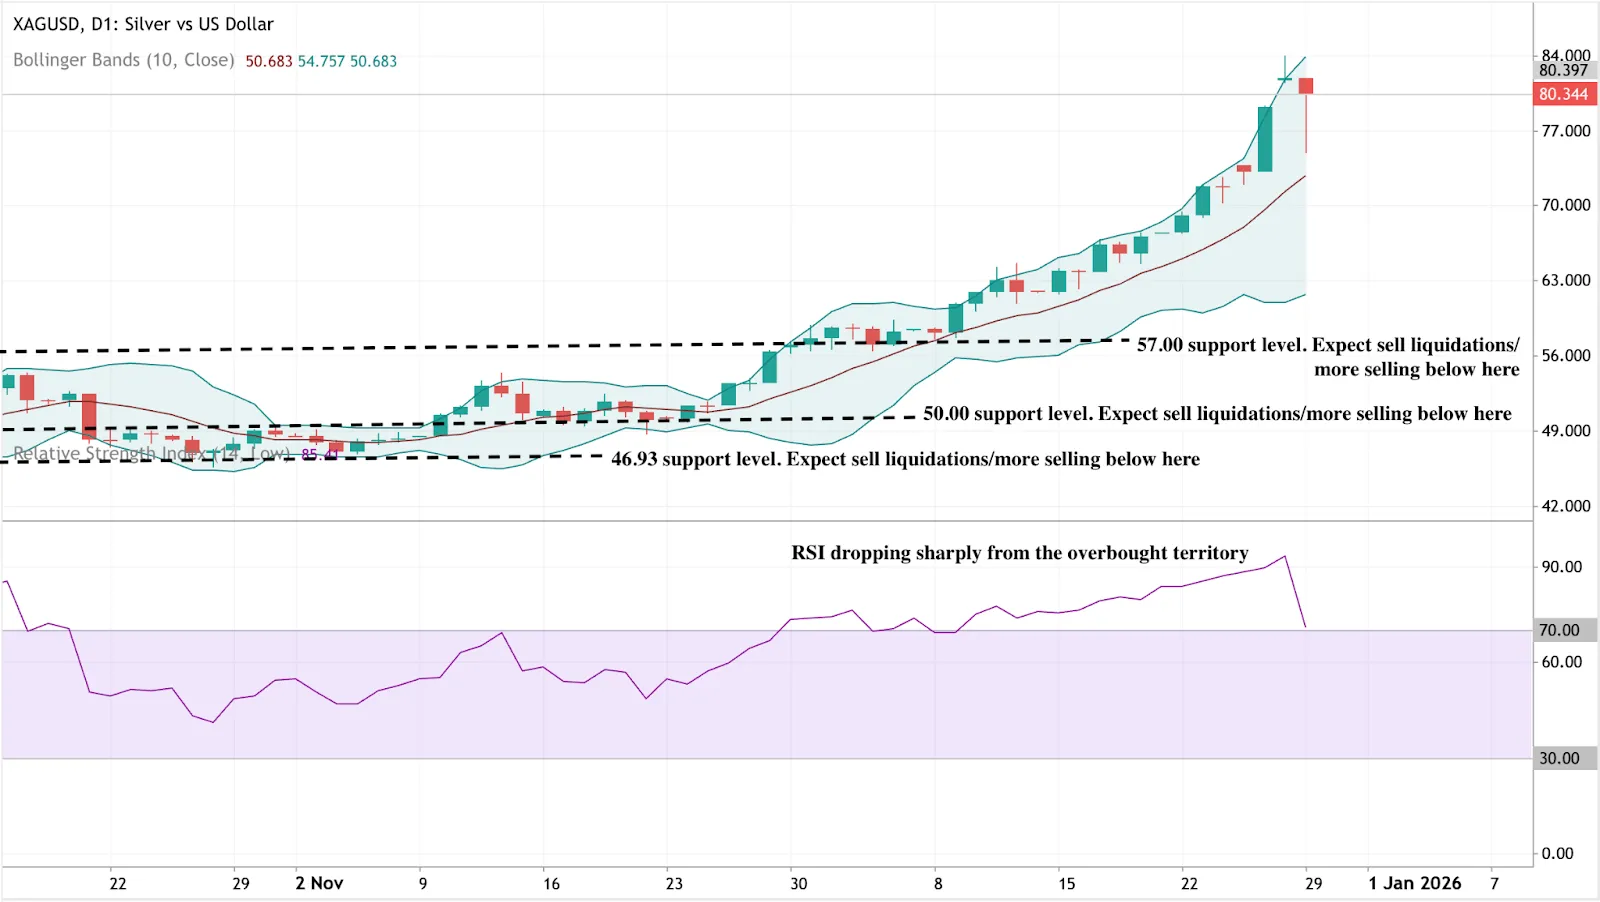
Silver has retreated sharply after spending an extended period near the upper Bollinger Band, a sign that upside momentum had become stretched. Prices remain elevated on a longer-term basis, but the recent rejection points to near-term profit-taking following an aggressive advance.
On the downside, $57.00 remains the first key support level, followed by $50.00 and $46.93. A sustained move towards the Bollinger mid-band would increase the risk of a broader corrective phase. Momentum indicators are cooling, with the RSI falling sharply from overbought levels, reinforcing the case for consolidation rather than an immediate continuation of the uptrend.
إخلاء مسؤولية:
The performance figures quoted refer to the past, and past performance is not a guarantee of future performance or a reliable guide to future performance.
الأسئلة الشائعة
Why did silver overtake Nvidia in market value?
Why are silver prices so volatile right now?
How do China’s export restrictions affect silver prices?
Is silver repeating the bubbles of 1980 or 2011?
Do high silver prices threaten renewable energy growth?


