Contents
Article
Why Silver prices hit $50 for the first time in four decades
October 13, 2025
Article
Why Silver prices hit $50 for the first time in four decades
October 13, 2025
Article
Why Silver prices hit $50 for the first time in four decades
October 13, 2025
Silver’s climb above $50 per ounce in 2025 marks a defining moment for the precious metals market. The rally was sparked by a combination of tight physical supply, aggressive short covering, and rising investor appetite for safe-haven assets amid expectations of Federal Reserve rate cuts.
The squeeze intensified as liquidity in London’s bullion market evaporated, forcing traders to unwind short positions at steep costs. Meanwhile, ETF inflows hit multi-year highs, reflecting growing interest in silver as both an inflation hedge and a speculative vehicle. The result is the most dramatic price breakout since 1980 - but with volatility levels to match.
Key takeaways
- A record short squeeze in London propelled silver above $50, the highest level in 45 years.
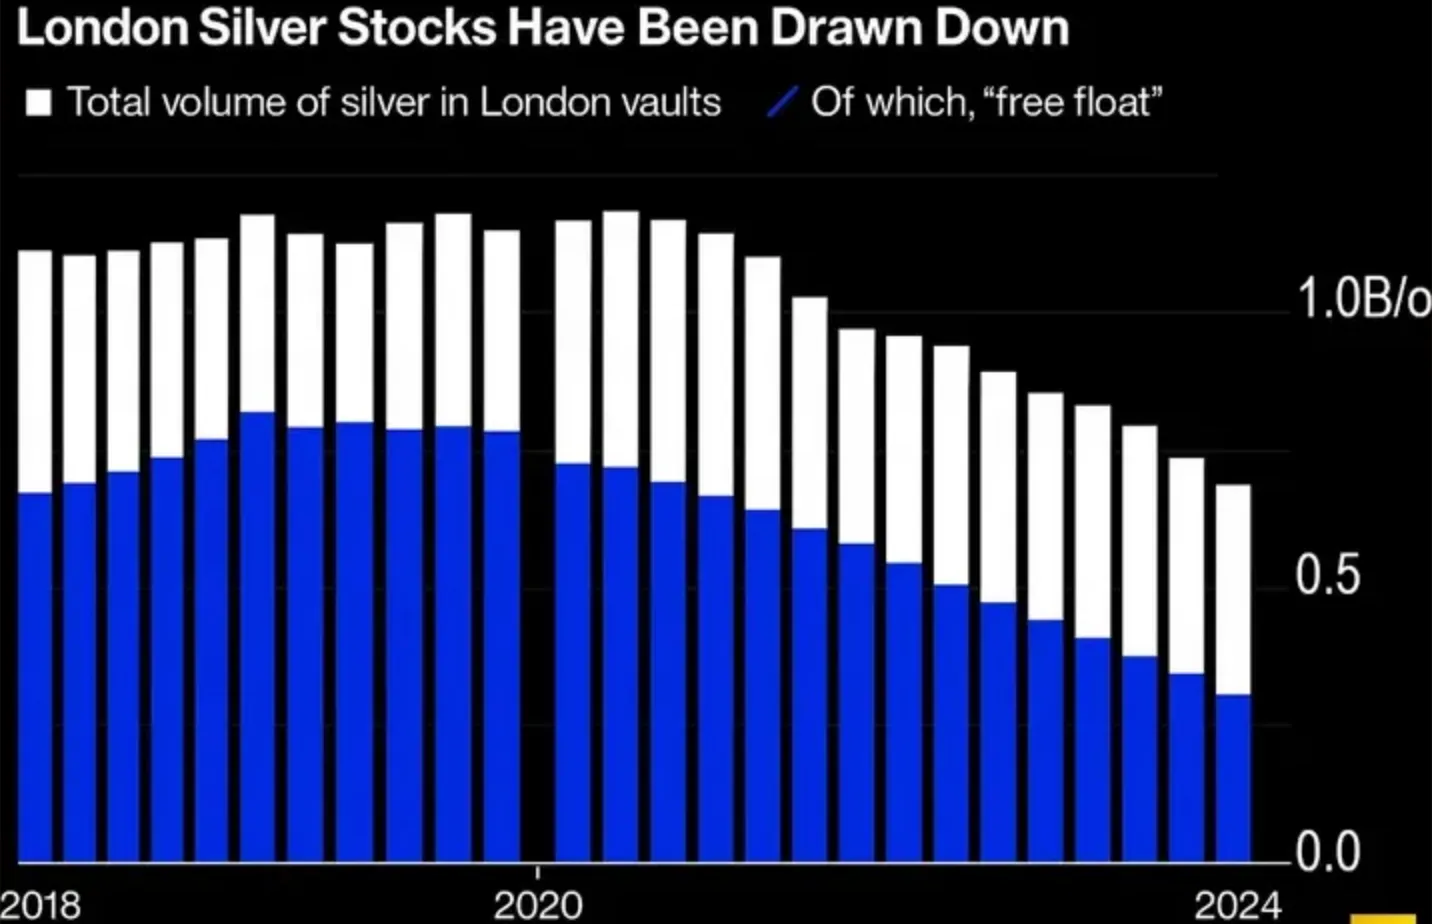
- Inventories have fallen nearly 75% since 2019, leaving the market critically tight.
- ETF inflows into silver reached their highest levels since 2020, amplifying upward momentum.
- Goldman Sachs expects medium-term gains but warns of sharp short-term corrections.
- Industrial demand remains supportive, but substitution with copper continues to cap growth.
- Silver’s market size - roughly one-ninth of gold’s - magnifies price swings.
Drivers behind the breakout: Silver short squeeze explained
According to Goldman Sachs, silver’s ascent has been powered by private investment flows, similar to those driving gold. The bank estimates that every 1,000 tonnes of new silver bought adds about 1.6% to its price.
However, 2025’s move was accelerated by a severe liquidity crunch and short squeeze that caught traders off guard. Liquidity in London’s bullion market dried up, pushing borrowing costs to record highs as traders scrambled to roll short positions.

The result was a $3 premium for London spot silver over U.S. futures — a rare divergence not seen in previous cycles. Reports even surfaced of traders air-shipping silver bars from the U.S. to the U.K. to capitalise on the arbitrage, a practice typically reserved for gold.
London silver inventories have dropped by three-quarters since 2019, with freely available (“free float”) holdings now at roughly 200 million ounces.
The squeeze was compounded by strong Indian imports, tariff fears surrounding U.S. critical minerals policy, and safe-haven flows as investors reacted to fiscal and geopolitical uncertainty.
Silver ETF inflows add to the volatility
Silver’s smaller market size - around $50 billion versus gold’s $450 billion - makes it exceptionally reactive to capital inflows. Even modest fund movements can drive large price swings.
Gold’s price tends to be more stable because of consistent central bank buying, while silver depends on private investors and speculative positioning. Without institutional support, silver’s price cycle is driven largely by sentiment and liquidity - both of which can shift rapidly.
Goldman Sachs still expects silver to trend higher in the medium term, but warns volatility could be steeper than gold’s. The bank highlights two major risks:
- ETF inflows could ease, following their rapid expansion during the rate-cut cycle.
- London inventory restocking might stall if traders hesitate to ship silver amid U.S. tariff probes.
For readers tracking cross-asset moves, our gold breakout analysis explores similar dynamics in gold’s surge, helping traders compare how both metals are reacting to Fed policy shifts.
Silver Industrial demand: a mixed picture
Silver’s industrial base - especially in solar panels, electronics, and EVs - remains a cornerstone of demand. Yet, this cycle has been led more by financial flows than factory floors.
Growth in solar output has slowed, and manufacturers are increasingly using copper to contain costs. Analysts at Goldman Sachs say industrial consumption provides a cushion but no longer defines the price direction.
Still, silver’s dual identity keeps it unique among metals. As ING strategist Ewa Manthey notes:
“Its dual role as an industrial metal and safe-haven asset has amplified the rally, making 2025 a historic year for silver.”
Silver Market outlook: Powell, inflation, and the path to $55
Markets are now focused on Fed Chair Jerome Powell’s speeches on October 14 and 16, and key data on U.S. PPI, retail sales, and jobless claims.
- If Powell hints at imminent rate cuts, silver could extend its run toward $55 per ounce or higher, according to analysts,
- If data surprises to the upside, a short-term correction toward $47–$48 remains likely as traders unwind longs.
In short, silver’s trajectory now depends less on mine output and more on global liquidity, interest-rate expectations, and trader sentiment.
Silver price technical insights
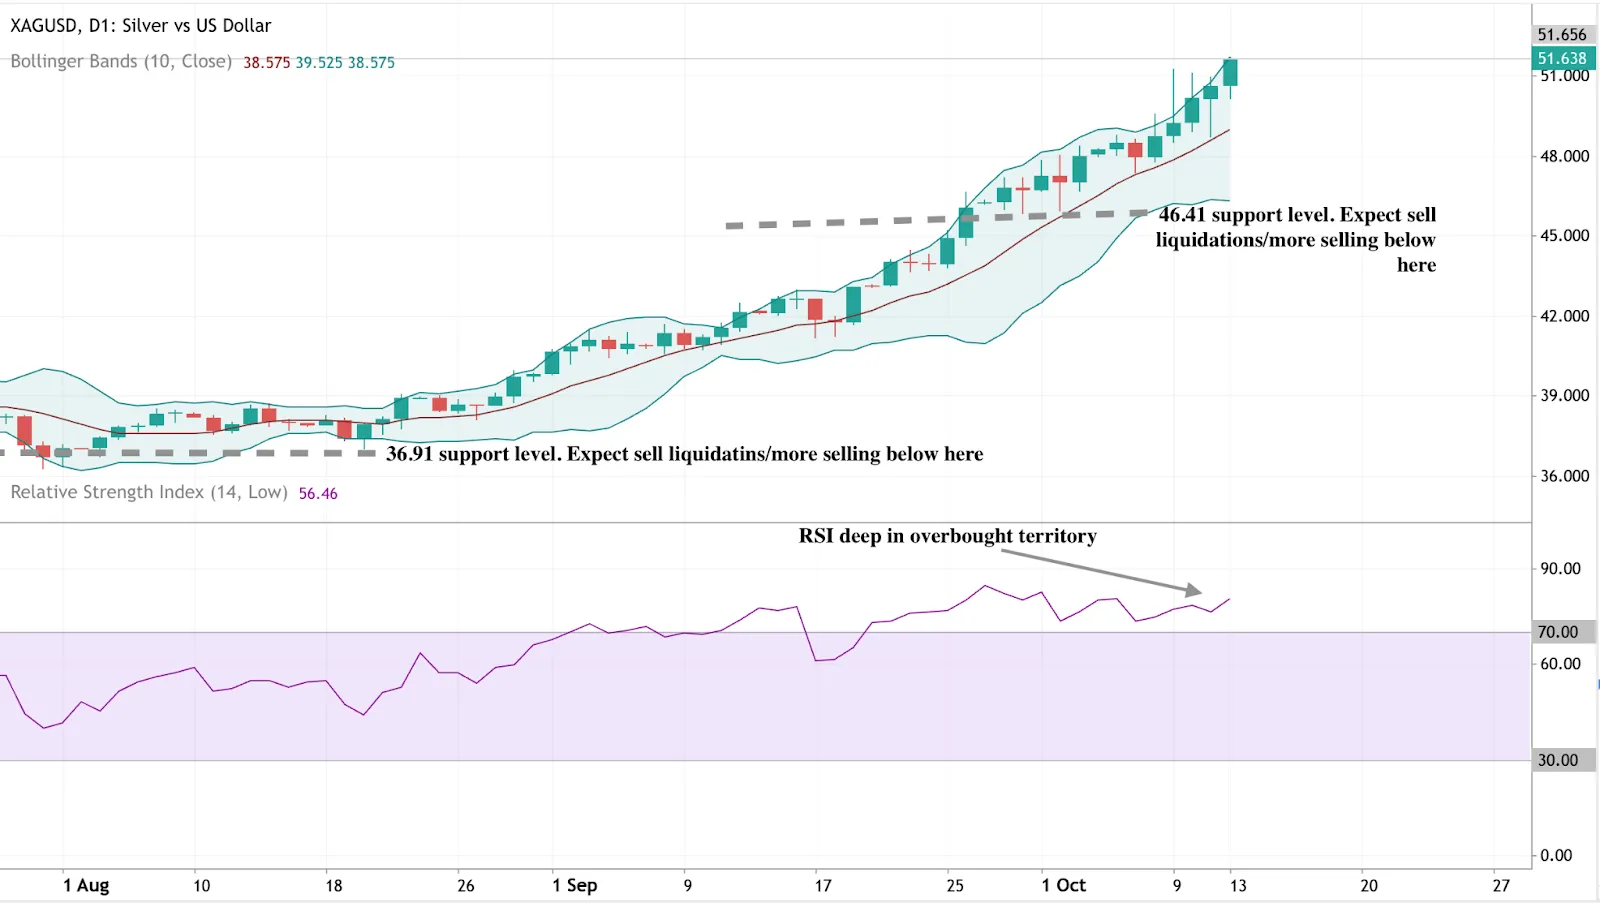
At present, silver is testing overbought conditions after a parabolic rally. Prices have pushed to fresh highs, but technical indicators suggest a potential cooldown. The RSI remains deep in overbought territory, and the price is touching the upper Bollinger Band, signaling possible consolidation.
If prices correct, support may appear near $46.41 and $36.91 before buyers re-emerge.
Traders on Deriv MT5 can monitor these technical levels in real time, using advanced charting tools to identify breakouts and retracements.
Deriv traders: capturing opportunity in silver’s volatility
The 2025 silver surge has created fertile ground for Deriv traders to capture moves across multiple timeframes.
Through Deriv MT5, traders can access XAG/USD with competitive spreads, flexible leverage, and cross-market analysis alongside gold, oil, and crypto pairs.
- Short-term traders can explore intraday volatility using MT5’s Expert Advisors (EAs) and built-in indicators.
- Swing traders can position for broader directional trends as silver oscillates between $47 and $55.
To manage exposure efficiently, Deriv’s trading calculator can help estimate margin requirements and potential profit or loss before entering a position - an essential tool when navigating periods of high volatility.
Silver Investment implications
For Deriv traders, silver’s $50 breakout signals a renewed opportunity to trade volatility with precision and control.
- Short term: Focus on Fed-driven volatility and inflation releases to time entries.
- Medium term: Use technical analysis on Deriv MT5 to monitor consolidation zones and trend continuation setups.
- Long term: Consider silver’s structural supply deficit as a hedge against inflation and dollar weakness.
Using Deriv’s calculator before placing trades can help manage leverage effectively - a vital step in a market where small moves can have outsized impacts.
Silver’s surge above $50 is more than a milestone; it’s a reminder of how swiftly markets can move when liquidity tightens. On Deriv platforms, traders have the speed, data, and tools to turn volatility into an informed opportunity.
Disclaimer:
The performance figures quoted are not a guarantee of future performance.
FAQs
Is silver’s rally sustainable?
How does gold influence silver’s rally?
How does silver’s market compare to gold’s?
What role does industrial demand play?
What happened to the price of silver in 1980?
Will silver reach $55 or higher an ounce?


