Contents
Article
Bitcoin dips below $90K as demand momentum fades
December 23, 2025
Article
Bitcoin dips below $90K as demand momentum fades
December 23, 2025
Article
Bitcoin dips below $90K as demand momentum fades
December 23, 2025
%20(1)%20(1).webp)
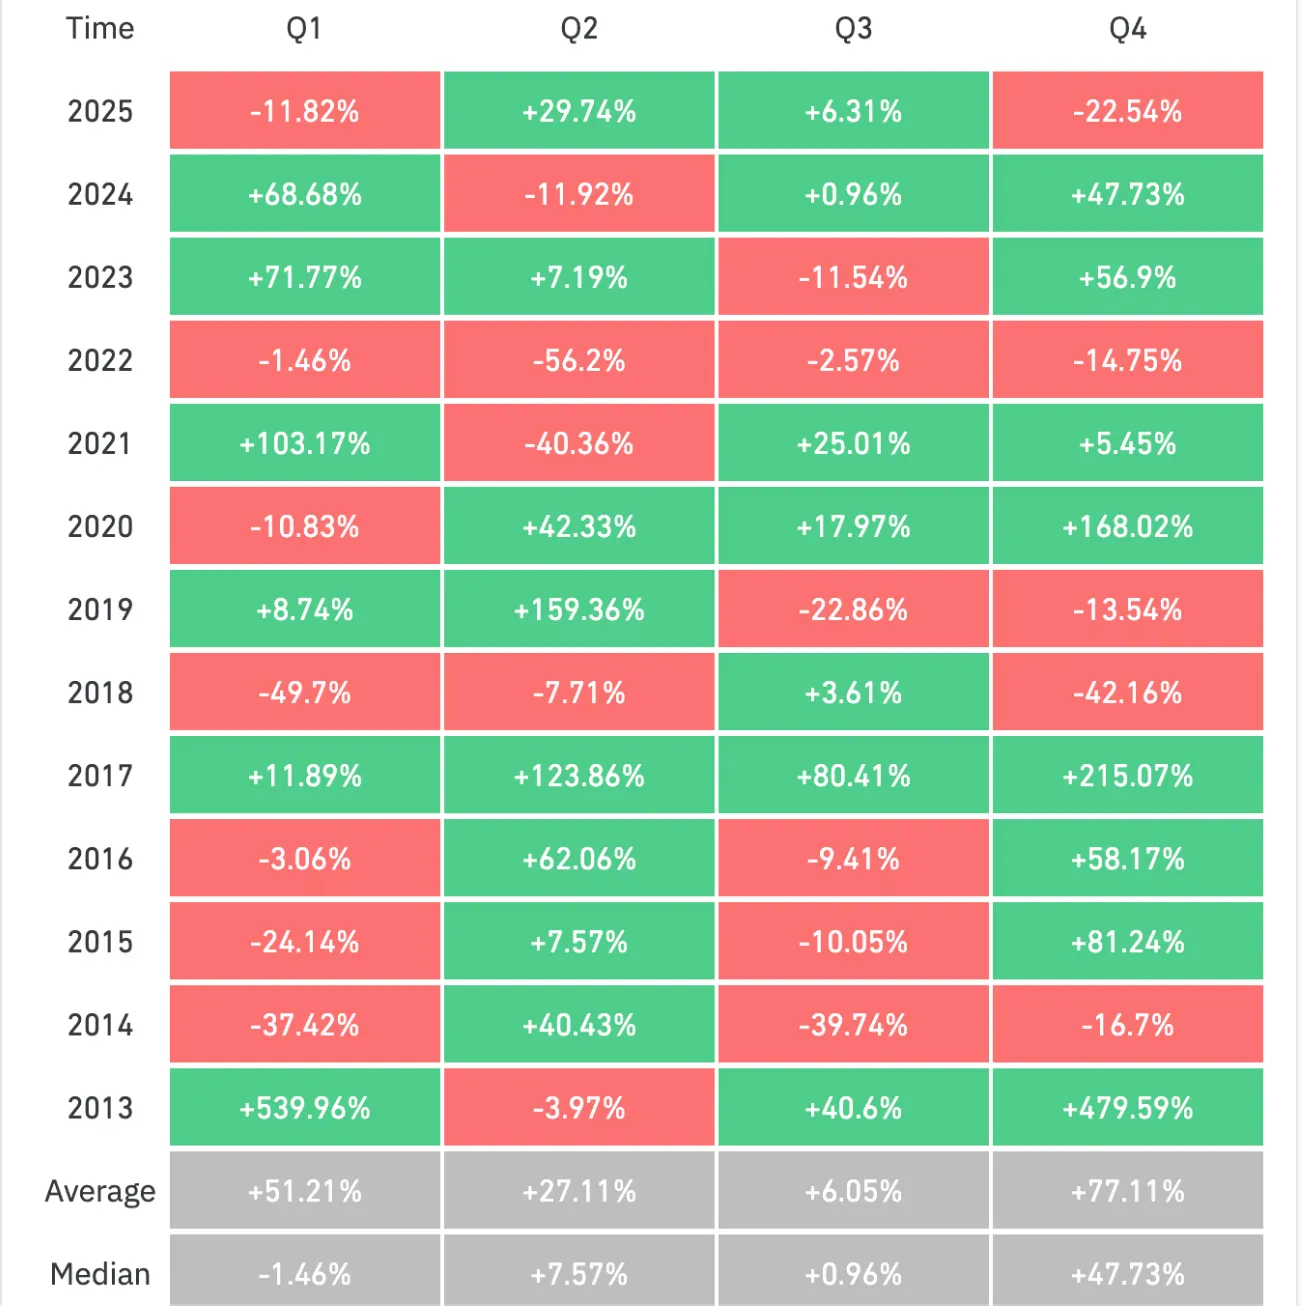
Bitcoin’s inability to stay above $90,000 is increasingly reflecting market fatigue rather than temporary turbulence. After dropping more than 22% during the fourth quarter, the largest cryptocurrency is heading towards one of its weakest year-end performances outside of prolonged bear markets, according to CoinGlass data.
Short-lived rebounds have struggled to gain follow-through, with advances during Asian and European sessions repeatedly unwinding once US trading begins. Analysts suggest this pattern points to something more structural. Mounting derivatives pressure, softer institutional flows, and deteriorating on-chain demand metrics all hint that Bitcoin may be losing the momentum that defined earlier phases of this cycle.
With record options expiries approaching and demand signals weakening, traders are increasingly questioning whether the market is consolidating or slipping into a more sustained downtrend.
What’s driving Bitcoin’s latest weakness?
Bitcoin’s slide below $88,000 during the US session appears driven by positioning dynamics rather than panic selling. Liquidity has thinned as traders adjust exposure ahead of a major derivatives event, leaving price action more vulnerable to sharp intraday swings.
Bitcoin’s weak year-end
Volatility has intensified within the $85,000–$90,000 range as markets brace for $28.5 billion worth of Bitcoin and Ethereum options set to expire on Deribit. That figure accounts for more than half of the exchange’s total open interest, magnifying sensitivity around major strike levels.
According to Deribit’s Chief Commercial Officer, Jean-David Pequignot, Bitcoin’s $96,000 “max pain” level remains central to current positioning. Meanwhile, a dense cluster of put options near $85,000 continues to exert downward pressure, particularly if spot prices weaken further. Although longer-dated bullish bets remain intact, rising short-term hedging costs suggest traders are prioritising protection over upside exposure.
Why it matters
The shift is notable because Bitcoin’s recent advances were largely powered by expanding demand rather than supply-side catalysts. Data from CryptoQuant shows that on-chain demand growth has slipped below its long-term average since early October, signalling a move from expansion to contraction.
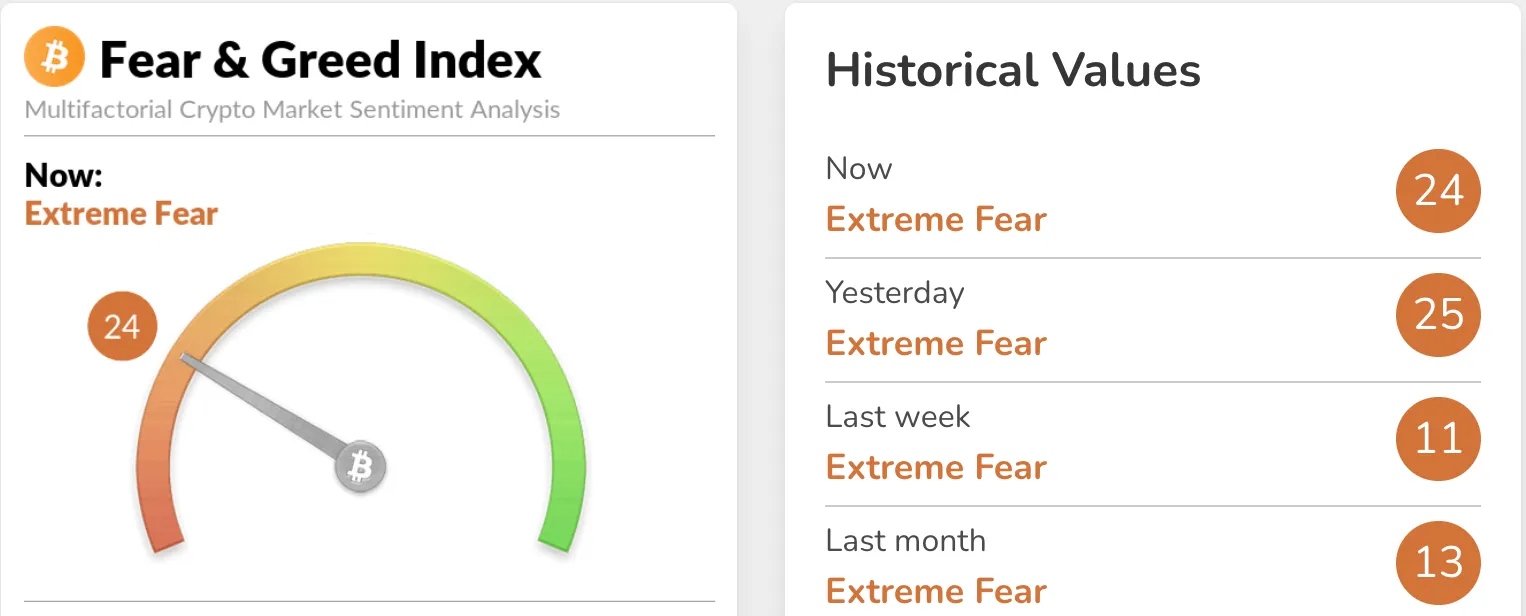
Historically, similar slowdowns have marked key turning points in Bitcoin’s cycle rather than brief pauses. That backdrop helps explain why rallies are struggling to sustain momentum. Alex Kuptsikevich, chief market analyst at FxPro, characterises recent rebounds as technical corrections rather than the start of a renewed uptrend. He notes that price stability is being supported more by positioning adjustments than by fresh conviction. Sentiment indicators reinforce this view, with the Crypto Fear and Greed Index ticking up to 24 but remaining firmly within extreme fear territory.
Impact on the crypto market and traders
Market data indicates that Bitcoin’s hesitation has spilled over into the wider crypto market, keeping major tokens locked in narrow ranges despite intermittent rallies. Ether, Solana, XRP, Cardano, and Dogecoin have all posted marginal gains, but none have managed to break decisively higher.
Total crypto market capitalisation has once again edged above $3 trillion, a level that has repeatedly acted as a dividing line between buyer interest and renewed selling pressure over the past month.
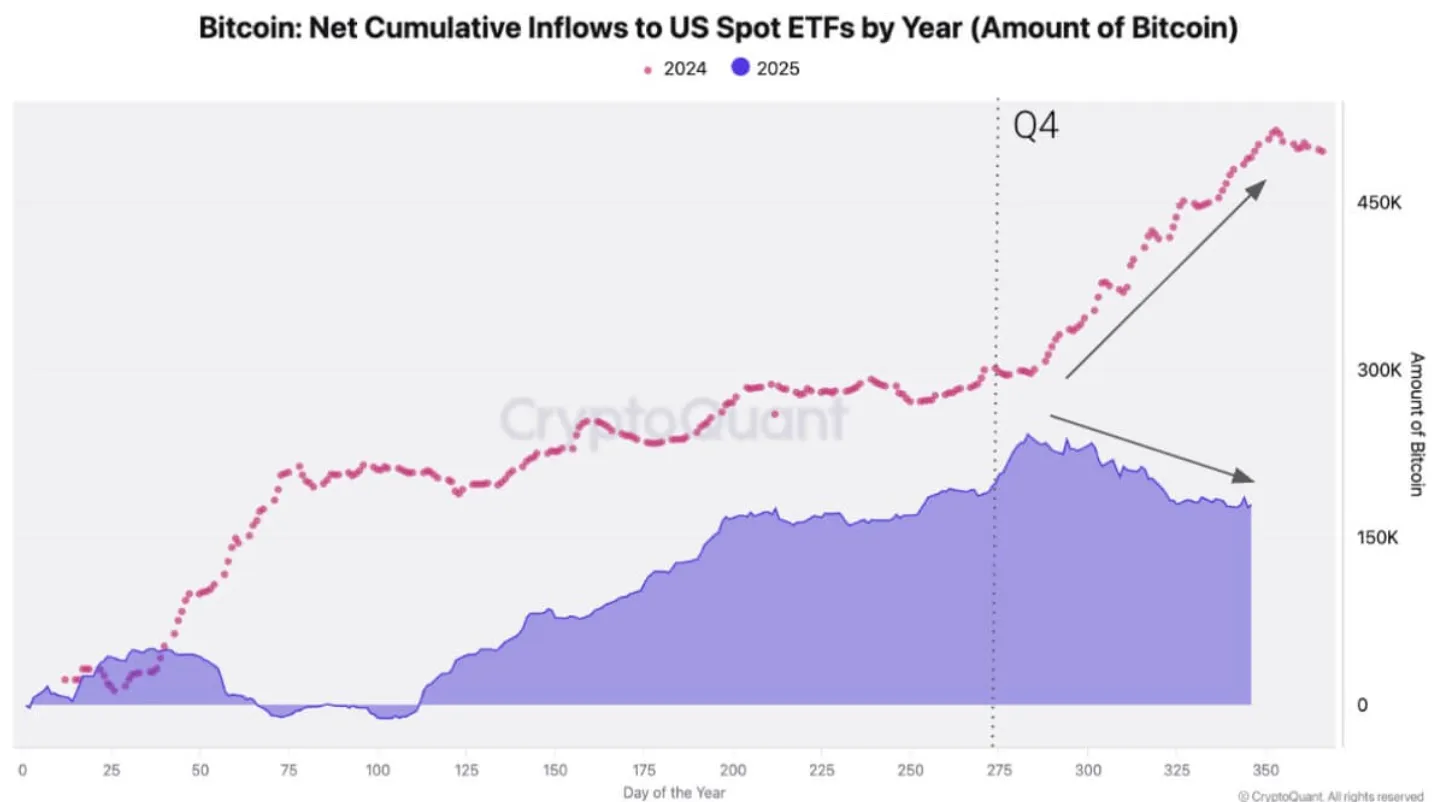
Beneath the headline figures, signs of stress persist. Market data shows that US spot Bitcoin ETFs have shifted from steady accumulation to net outflows, with holdings shrinking by around 24,000 BTC toward the end of 2025. At the same time, funding rates for perpetual futures have dropped to their lowest levels since late 2023, reflecting a fading appetite for leveraged long positions.
Expert outlook: Consolidation or downtrend?
CryptoQuant analysts caution that Bitcoin may already be transitioning into a new downtrend, driven primarily by demand exhaustion rather than external macro shocks. The major forces behind the previous rally-spot ETF launches, political developments in the US, and corporate treasury adoption-have largely been priced in. Without a fresh source of demand, downside risks remain elevated.
That said, the outlook is not uniformly bearish. CryptoQuant emphasises that Bitcoin’s longer-term cycles are shaped by demand recovery rather than fixed timelines such as halvings. If institutional inflows stabilise and on-chain activity improves, a rebound later in 2026 remains possible. Until clearer signals emerge, the market remains caught between optimistic six-figure projections and downside scenarios that place key support closer to $70,000.
Key takeaway
Bitcoin’s failure to reclaim $90,000 highlights growing structural strain rather than short-term market noise. Cooling institutional participation, defensive derivatives positioning, and weakening demand metrics all point to a more cautious phase for the market. While the long-term narrative remains intact, near-term risks continue to lean lower. Traders will be closely monitoring options expiry outcomes, ETF flows, and on-chain data for early signs of a shift in momentum.
Bitcoin technical insights
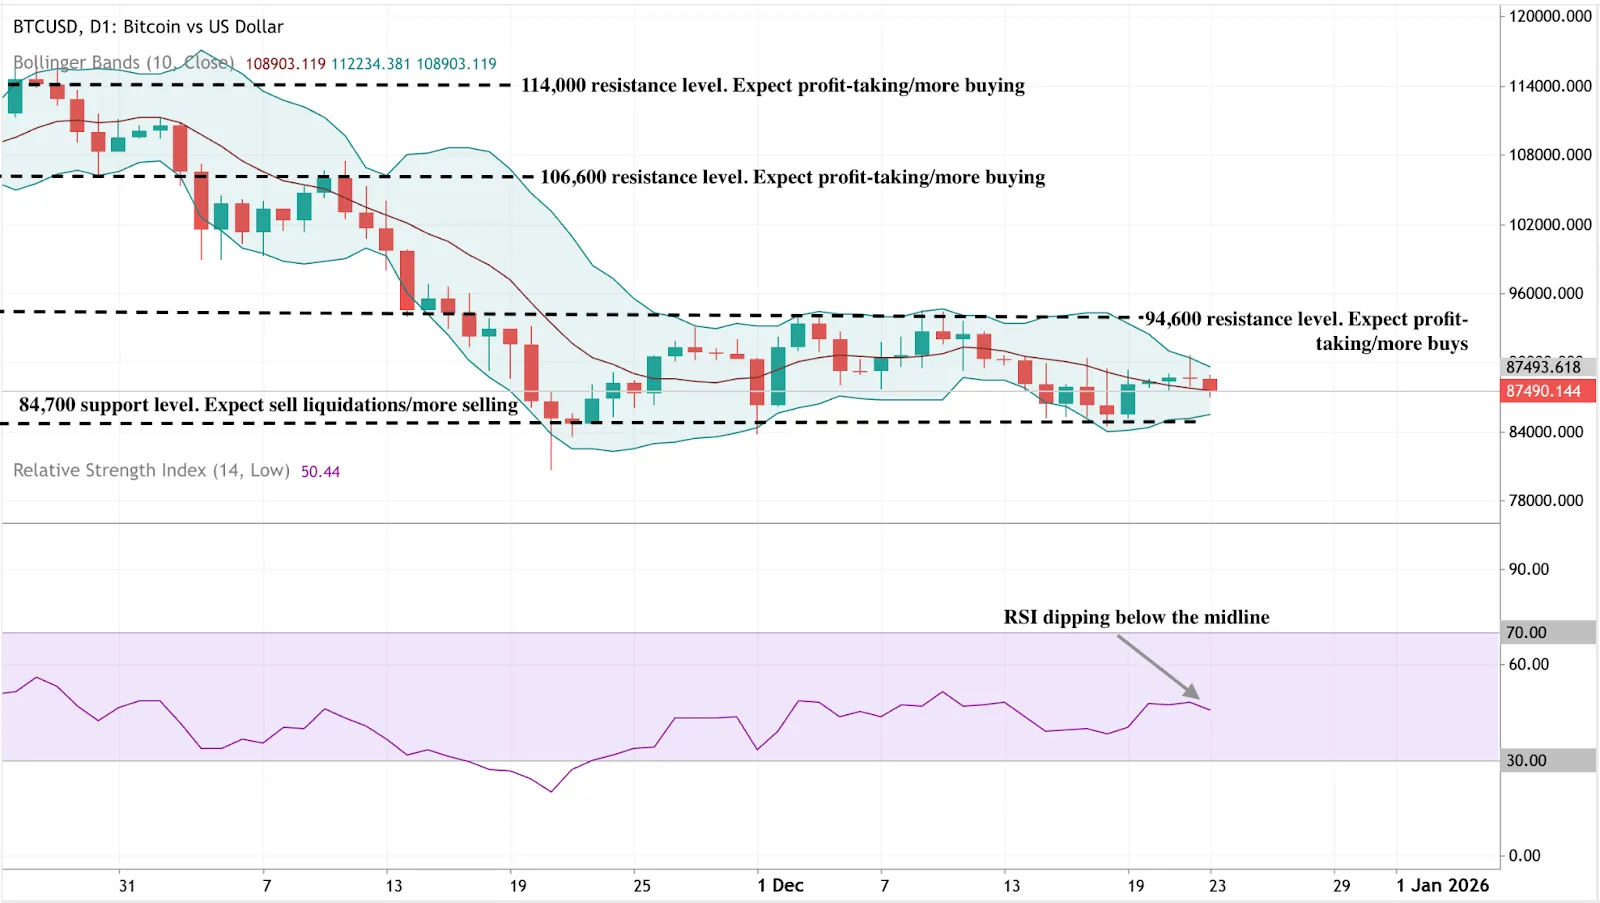
Bitcoin continues to trade within a broad range, with price repeatedly capped below the $94,600 resistance level. Trading near the middle-to-lower Bollinger Band reflects subdued upside momentum and a lack of sustained buying pressure. Attempts to push higher have faded quickly, keeping the broader structure corrective rather than impulsive.
On the downside, $84,700 remains a key support zone. A decisive break below this level could trigger increased sell-side activity as stops and liquidations come into play. Momentum indicators remain soft, with the RSI slipping just below the midline, suggesting bearish pressure is building gradually rather than accelerating sharply.
Disclaimer:
The performance figures quoted are not a guarantee of future performance
FAQs
Why is Bitcoin struggling to stay above $90,000?
What is the significance of Bitcoin’s Q4 performance?
Are institutions still buying Bitcoin?
What does “max pain” mean for Bitcoin options?
Could Bitcoin recover in 2026?


