Contents
Article
Bitcoin’s plunge to $77K reveals cracks in crypto’s rally
February 2, 2026
Article
Bitcoin’s plunge to $77K reveals cracks in crypto’s rally
February 2, 2026
Article
Bitcoin’s plunge to $77K reveals cracks in crypto’s rally
February 2, 2026

Bitcoin’s slide below $77,000 has been widely viewed as more than a standard market retracement. Analysts describe it as a stress test that exposed structural weaknesses beneath the surface. Since peaking near $126,000 in October, roughly $800 billion in market value has been erased, pushing Bitcoin out of the world’s ten largest assets and triggering more than $2.5 billion in forced liquidations in a single session.
The scale of the decline matters because it highlights what powered the rally in the first place. Leverage, limited liquidity and confidence that fresh buyers would always step in formed the backbone of the move higher. When geopolitical risk intensified and the US dollar strengthened, that confidence evaporated. What followed was not a rush to safety, but a vacuum of demand that allowed prices to fall with little resistance.
What’s driving Bitcoin’s crash?
Geopolitical tension was the immediate spark. Reports of rising friction between the United States and Iran dampened risk appetite and drove investors towards dollar liquidity. In theory, such conditions should have supported Bitcoin’s “digital gold” narrative. Instead, Bitcoin was sold aggressively, particularly during thin weekend trading, as traders prioritised access to cash.
That behaviour reflects Bitcoin’s evolving role in global markets. The asset trades around the clock, carries significant derivatives exposure and is now tightly woven into cross-asset risk strategies. When volatility spikes elsewhere, crypto often becomes the quickest source of liquidity. This time, shallow order books magnified the move.
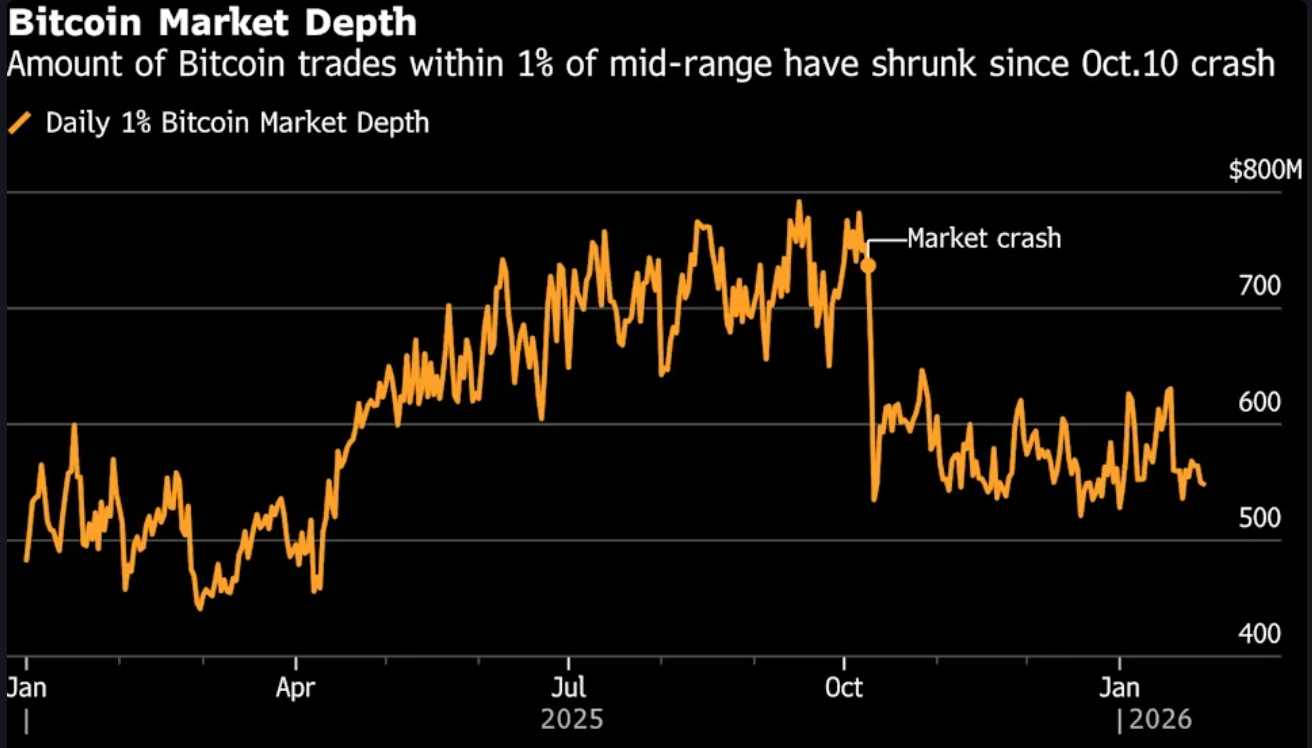
Data from Kaiko shows Bitcoin’s market depth remains more than 30% below its October peak, a level last seen in the aftermath of the FTX collapse in 2022.
Macro forces added further pressure. The nomination of Kevin Warsh to lead the Federal Reserve triggered a sharp rebound in the US dollar, prompting a broad repricing of risk assets. Gold fell nearly 9% in a single session, silver dropped more than 25%, and Bitcoin moved in lockstep. Rather than decoupling, crypto was swept up in a wider unwind of so-called “hard money” trades.
Why it matters
For many observers, the sell-off has challenged the narrative underpinning the latest crypto boom. Bitcoin has long been promoted as a hedge against inflation, currency debasement, and geopolitical turmoil. Over the past week, it failed to attract defensive inflows on all three fronts. Instead, it traded like a highly volatile, leveraged asset whose main utility was to generate liquidity.
The psychological impact may linger longer than the price decline itself. “This isn’t classic capitulation,” said Paul Howard, director at market maker Wincent. “It’s a lack of urgency to buy. When conviction fades, prices don’t need a catalyst to fall — they simply drift lower.” Markets often rebound quickly after panic. They recover far more slowly when apathy takes hold.
Impact on crypto markets and investors
The mechanical fallout has been significant. Nearly 200,000 traders were liquidated over the weekend as leveraged long positions were automatically unwound, intensifying the sell-off. Once key support levels failed, price action became dominated by forced selling rather than discretionary participation.
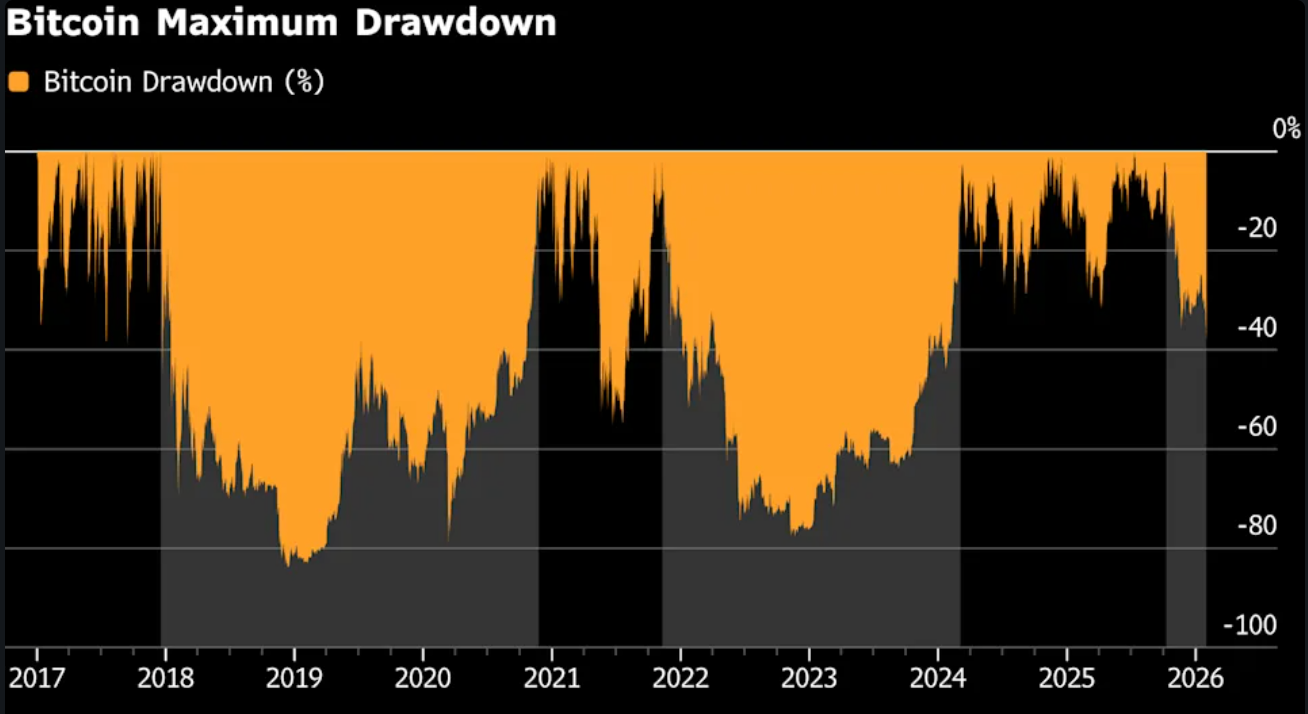
Retail investors have absorbed much of the pain. On-chain data shows holders with fewer than 10 BTC have been steady net sellers for more than a month. Many entered near the peak and are now facing drawdowns of more than 30%. Larger holders, by contrast, appear to be accumulating quietly. Wallets holding more than 1,000 BTC have absorbed supply without triggering a meaningful recovery.
Institutional demand has also cooled. Spot Bitcoin ETFs have continued to record net outflows, signalling reduced appetite among mainstream investors who bought near the highs. Digital asset treasury firms, once consistent buyers, have slowed activity following sharp declines in their own equity valuations, removing another source of support.
Expert Outlook
Many analysts now view the downturn as part of a broader cycle rather than a short-lived adjustment. Laurens Fraussen of Kaiko notes that previous crypto downturns were characterised by extended periods of shrinking volumes. After the 2017 peak, spot trading volumes fell by 60% to 70%. The 2021–2023 drawdown saw a smaller, but still severe, contraction of 30% to 40%. Current indicators suggest the market may still be in the early stages of the present cycle.
Others argue that Bitcoin is facing stronger competition for investor attention. Richard Hodges, founder of Ferro BTC Volatility Fund, believes momentum has shifted elsewhere. “Capital is being drawn to AI-related equities and precious metals,” he said. “Bitcoin feels like yesterday’s trade. I wouldn’t expect a new all-time high for some time.”
History offers limited reassurance. After the 2017 rally, Bitcoin took almost three years to set a new high. Following the 2021 peak, recovery took more than two years. By those measures, time rather than price may prove the more formidable obstacle.
Key takeaway
Bitcoin’s drop to $77,000 did not reveal panic — it revealed vulnerability. The rally was built on leverage, momentum and the assumption of constant demand. When liquidity thinned, that assumption broke down. The next phase will be shaped not by headlines, but by whether conviction, trading activity and genuine demand can return at the same time.
Bitcoin technical outlook
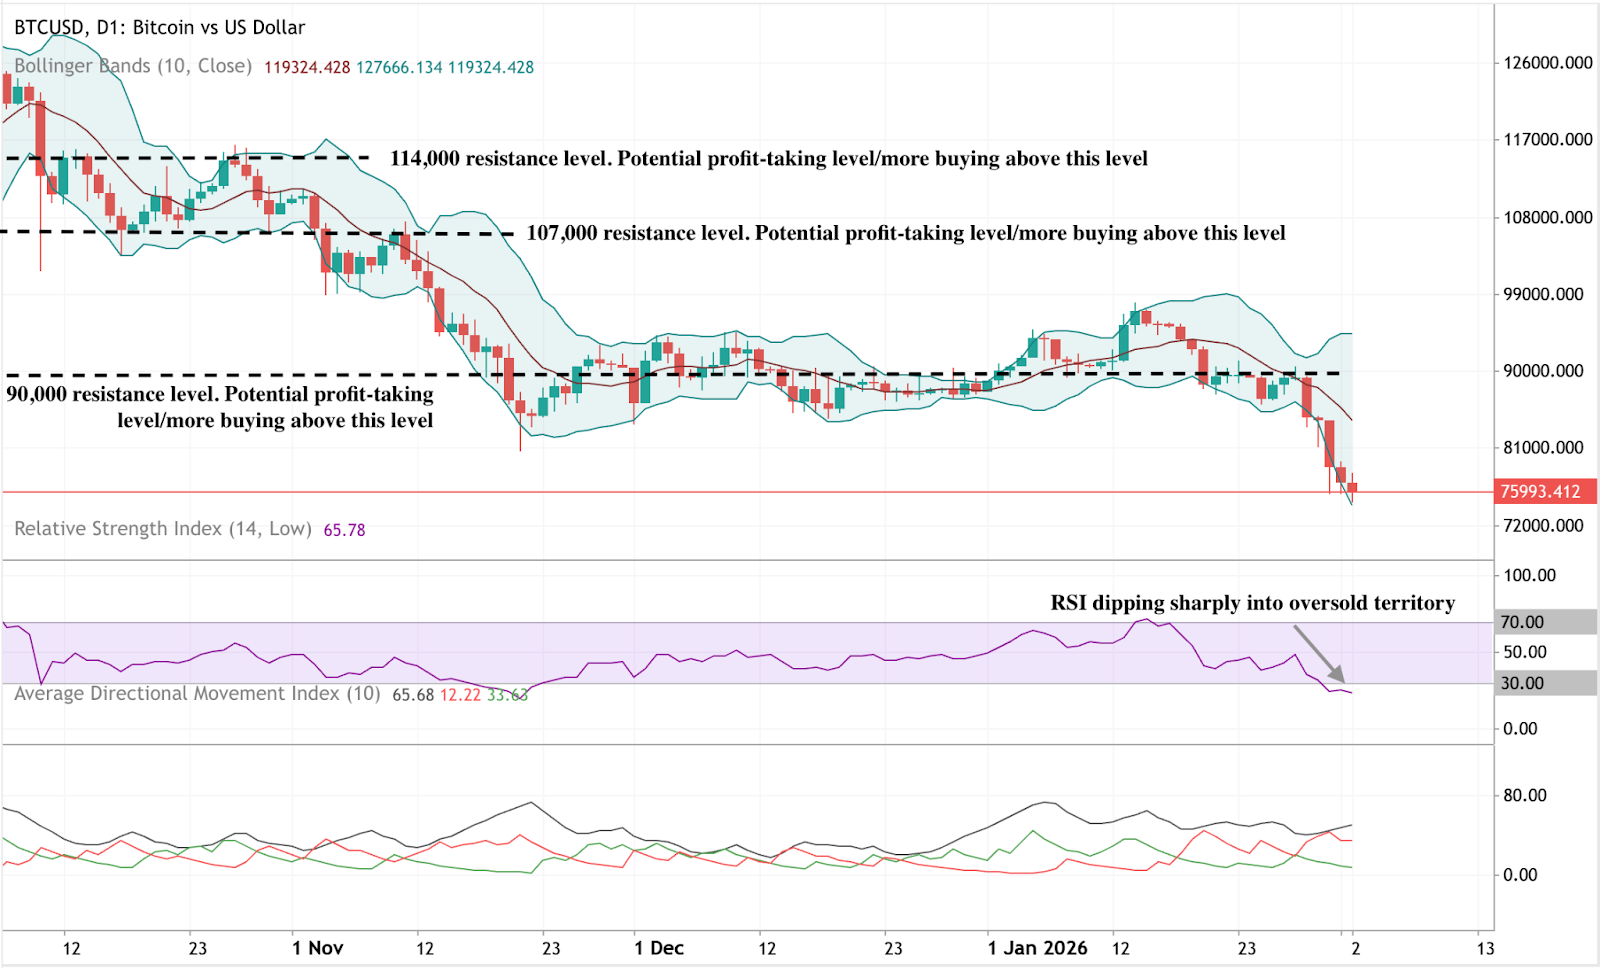
Bitcoin has fallen sharply from its recent consolidation zone, pushing towards the lower boundary of its broader price structure. Price action is hovering near the lower Bollinger Band, while the widening of the bands highlights elevated volatility following the recent sell-off.
Momentum indicators reflect the severity of the move. The RSI has dropped deep into oversold territory, pointing to a rapid deterioration in short-term momentum rather than a gradual decline. Trend strength remains elevated, with ADX readings still high, indicating that the broader trend environment remains active even as direction has turned lower.
From a structural perspective, price has broken decisively below the former consolidation area around $90,000. Previous resistance levels near $107,000 and $114,000 now sit well above the market, underlining the scale of the breakdown.
Disclaimer:
The information contained on the Deriv Market News is for educational purposes only and is not intended as financial or investment advice. The information may become outdated, and some products or platforms mentioned may no longer be offered. We recommend you do your own research before making any trading decisions. The performance figures quoted refer to the past, and past performance is not a guarantee of future performance or a reliable guide to future performance.
FAQs
Why did Bitcoin fall below $77,000?
Is Bitcoin still a hedge against global instability?
Are large investors buying the dip?
Could Bitcoin fall much further?
Do ETFs support long-term prices?


