Contents
Article
Bitcoin sinks below $90K as ‘death cross’ sparks fear
November 18, 2025
Article
Bitcoin sinks below $90K as ‘death cross’ sparks fear
November 18, 2025
Article
Bitcoin sinks below $90K as ‘death cross’ sparks fear
November 18, 2025

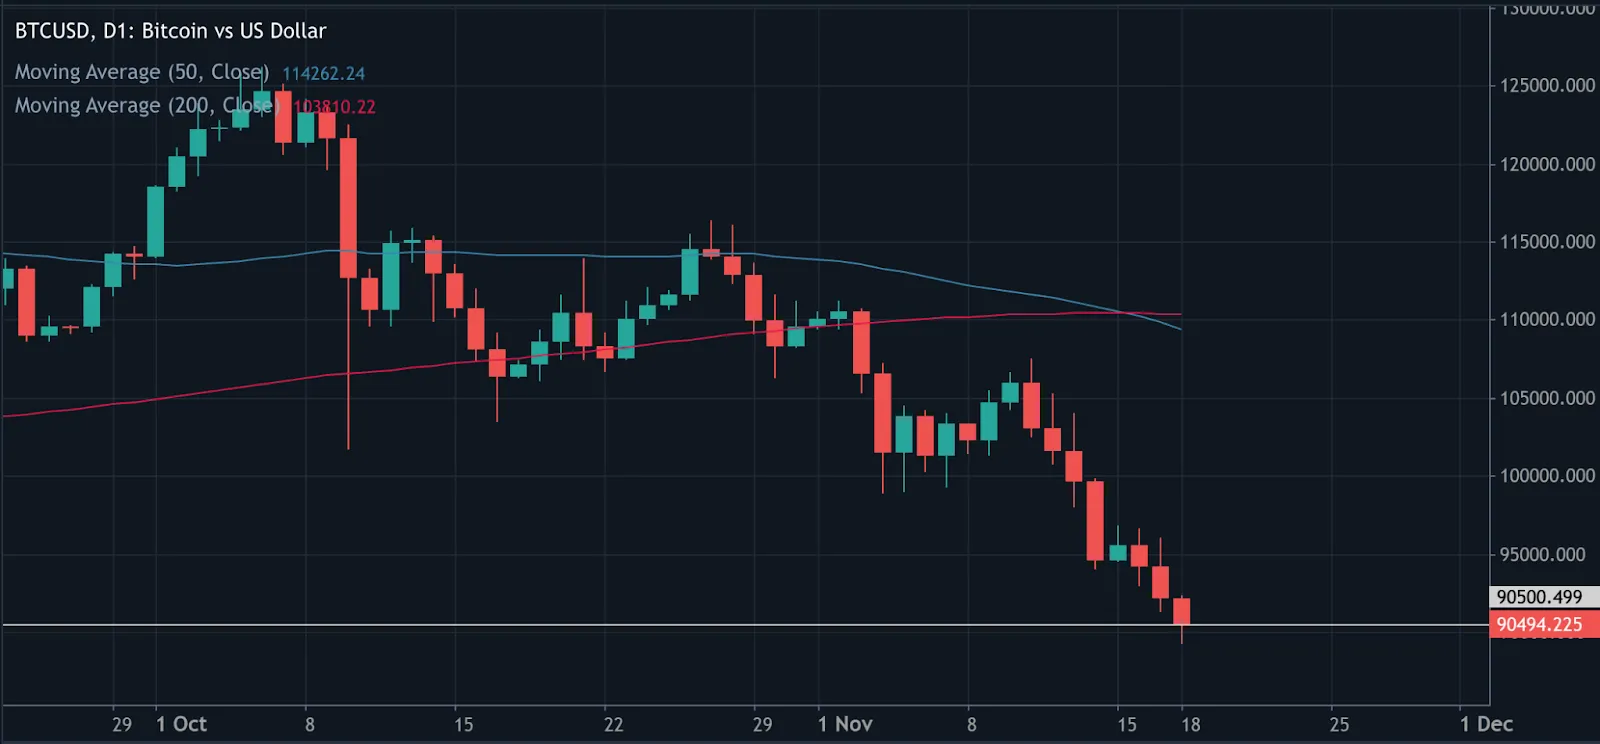
Bitcoin fell beneath $90,000 on Tuesday, extending a selloff that has erased its 2025 gains and sent sentiment to fresh lows. Prices hit $89,420 - the weakest level since February - just six weeks after touching record highs near $126,250.
The slide came as a death cross formed on daily charts and fund flows into U.S. spot ETFs turned increasingly hesitant.
Combined with growing macro anxiety over the rate path, these forces have drained liquidity and intensified volatility across the crypto space. Whether Bitcoin can reclaim key support and stabilise ETF inflows will likely determine the next move.
What’s driving the slide
The initial trigger was technical. Bitcoin broke below reclaimed support around $93,700, slipped under its 200-day moving average, and confirmed a death cross as the 50-day average fell beneath the 200-day line.
While not a flawless signal, this crossover often coincides with multi-week pullbacks in low-liquidity conditions as traders unwind risk.
ETF flows added pressure. After a strong start to the year, U.S. spot ETFs have seen erratic activity, with several consecutive days of flat or negative prints reducing marginal demand. When the steady bid disappears, price tends to probe thinner liquidity zones until new buyers step in - something current dashboards clearly reflect.
The Mt. Gox repayments – a trigger, not the cause
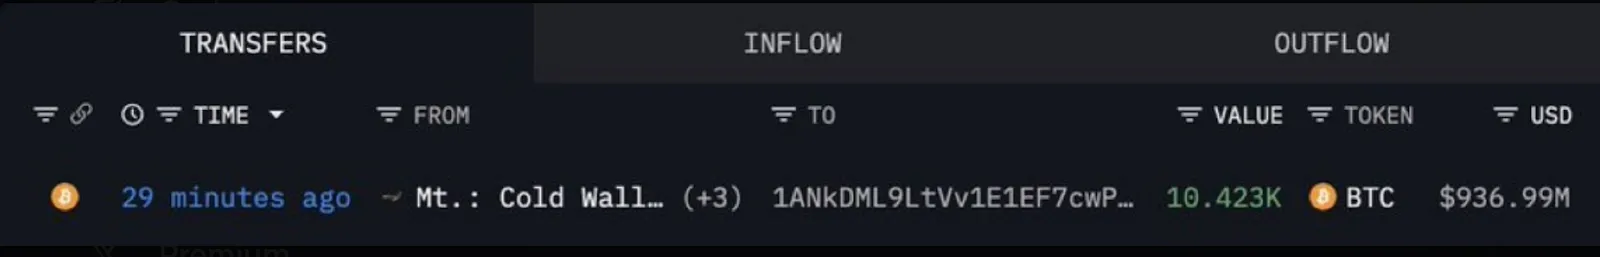
A new source of unease came from Mt. Gox, the defunct exchange that has haunted Bitcoin for over a decade. On 18 November 2025, more than 10,600 BTC - worth roughly $953 million - moved from its wallets, the first transfer in eight months.
Although many feared this could flood the market with new supply, blockchain data indicates these were administrative transfers, not active sales. Still, perception alone rattled sentiment, sparking a wave of liquidations as leveraged traders scrambled to exit. Analysts estimate over 230,000 accounts were wiped out within 24 hours, totalling more than $1 billion in forced selling.
Why this matters
Fear has gripped the market. CoinDesk’s “Extreme Fear” index underscores the mood, echoing the deep pessimism seen in prior cycle lows. Historically, such readings have marked either the capitulation phase of a broader correction or a temporary exhaustion point before recovery.
Meanwhile, the macro backdrop remains challenging. Traders are reassessing U.S. rate-cut expectations amid stubborn inflation signals and uncertain policy moves. That combination has curbed risk appetite and tightened liquidity, dragging crypto alongside equities.
As Reuters noted, Bitcoin has now retreated almost 30% from its October peak - an echo of institutional caution rippling through risk assets.
Impact on markets and participants
Bitcoin has regained short-term dominance as traders dump altcoins to reduce exposure - a pattern typical during stress phases when attention concentrates on the benchmark asset.
Ether and other large-cap tokens have followed lower, while crypto-related equities have amplified the downside, transmitting digital-asset volatility into traditional markets.
For institutional allocators, ETF data remains the most transparent proxy for real-time demand. Extended periods of flat or negative flows often expose fragility in order books, leading to heavier slippage. If this stagnation persists, traders warn that the $86,000–$88,000 liquidity gap could soon be tested.
Expert outlook
CoinDesk’s market desk suggests that spikes in fear like this one have sometimes preceded relief rallies - particularly when realised losses begin to stabilise and ETF outflows slow.
However, a recovery will depend on whether Bitcoin can reclaim broken support and attract fresh inflows. Until that happens, analysts expect two-way volatility to remain elevated.
Long-term investors remain unfazed. Figures like Dan Tapiero of 50T continue to highlight Bitcoin’s structural tailwinds - rising institutional adoption and broader digital-asset integration - as reasons to stay optimistic over a multi-year horizon.
Historically, death crosses have often occurred near the end of corrections rather than their beginning, suggesting this drawdown could be closer to its final phase than its first.
Bitcoin price technical analysis
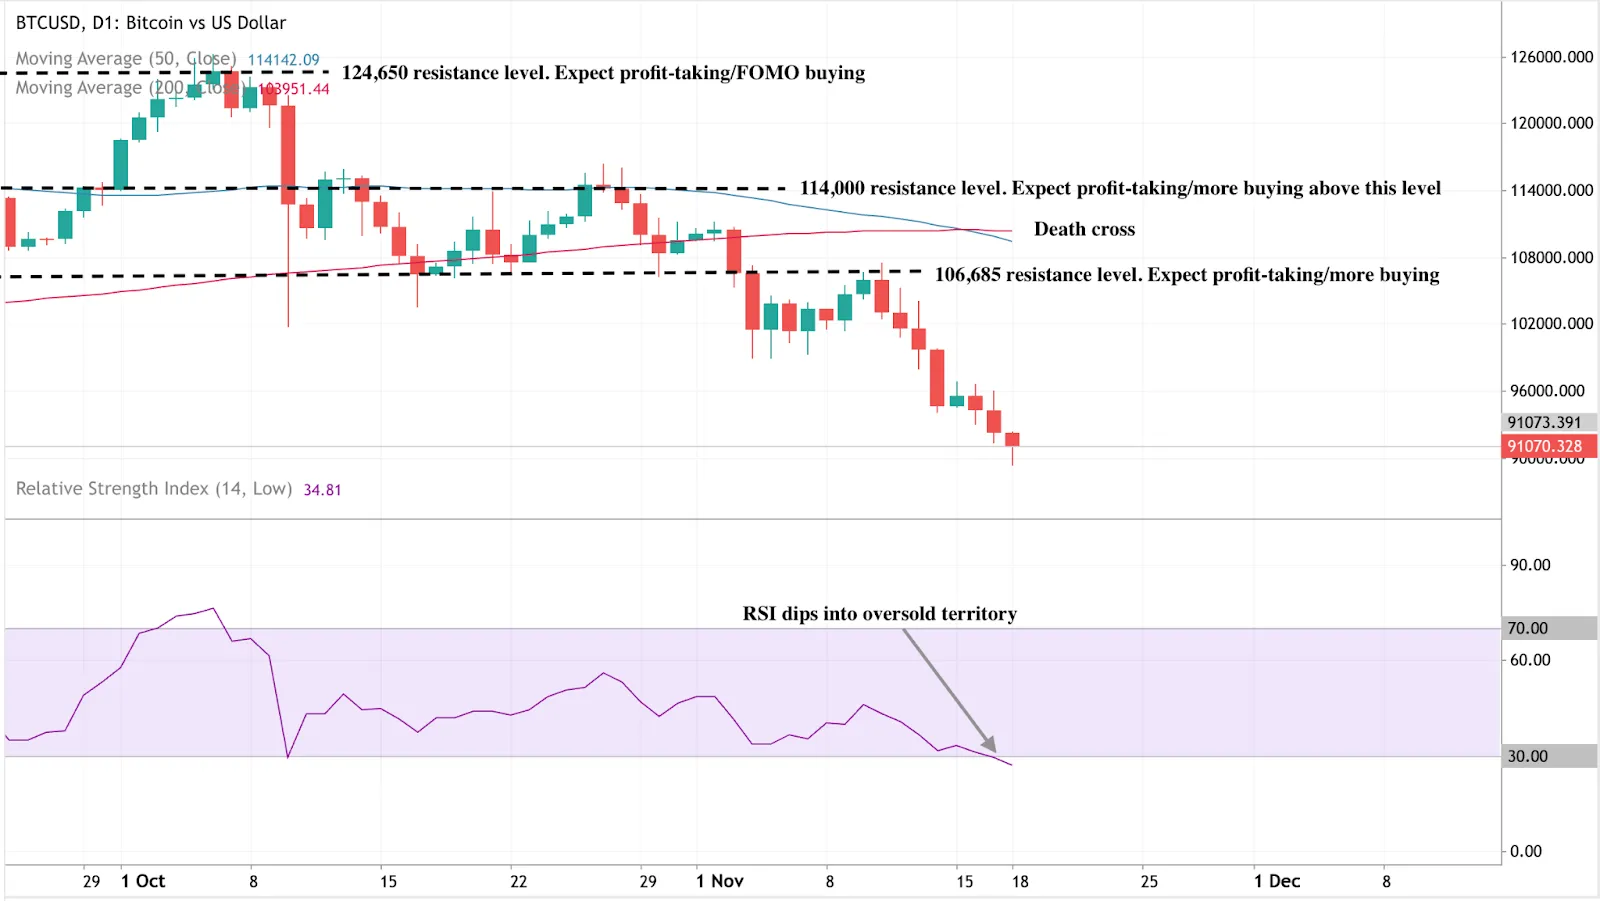
Bitcoin (BTC/USD) continues to face downward pressure following the death cross confirmation—where the 50-day moving average fell below the 200-day, signalling persistent bearish momentum. The price currently hovers around $91,000, struggling to reclaim lost ground after failing to hold key resistance levels at $106,685, $114,000, and $124,650.
The RSI has slipped into oversold territory, hinting that selling momentum may be stretched and a short-term bounce could follow. Still, as long as Bitcoin trades beneath its 50-day moving average, rallies may be short-lived, with traders likely to sell into strength.
Key takeaway
Bitcoin’s drop below $90,000 reflects a perfect storm of technical breakdown, ETF hesitation, Mt. Gox repayment fears, and a risk-off macro climate.
This type of panic is typical near the late stages of major selloffs - but before calling a bottom, markets need evidence of steady inflows and regained support around $90,000–$93,000.
Until then, expect sharp intraday swings, thin liquidity, and a cautious tone to dominate trading.
Disclaimer:
The performance figures quoted are not a guarantee of future performance.
FAQs
What exactly is the bitcoin “death cross,” and why did traders react?
Did bitcoin really erase its 2025 gains in this drop?
Are ETFs to blame for the drawdown?
Is sentiment really at “extreme fear”?
What would improve the outlook near term?


