Contents
Article
Gold above $5,000: Why this bull run may still have legs
January 29, 2026
Article
Gold above $5,000: Why this bull run may still have legs
January 29, 2026
Article
Gold above $5,000: Why this bull run may still have legs
January 29, 2026

Gold’s break above $5,000 an ounce has done more than clear a psychological hurdle - it has upended much of the forecasting framework used by banks and research desks. Prices surged to a fresh record near $5,600 this week, adding more than 10% in a matter of days and pushing year-to-date gains beyond 27%, after a powerful 64% advance in 2025. Silver has followed suit, pushing toward $120 an ounce as investors seek lower-priced exposure to the same macro forces lifting gold.
What makes this rally distinctive is not just the pace, but the depth of support underneath it. Demand is building simultaneously across central banks, institutions, and retail buyers, while supply remains slow to respond. With geopolitical tensions, ballooning sovereign debt, and reserve diversification all feeding into the move, gold’s surge raises a critical question: are markets nearing the end of a cycle, or witnessing a long-term repricing of value?
What’s driving Gold’s surge?
Gold’s recent behaviour is rooted in what remains unchanged. Global supply continues to grow at a modest 1–2% annually, and higher prices have little immediate impact on production. Bringing new mines online takes years, often decades, limiting supply flexibility. When prices accelerate, it is typically demand shifts - not supply shocks - that explain the move.
That demand has undergone a structural turn. Central banks, long viewed as steady sellers, have become persistent buyers. Annual purchases exceeded 1,000 tonnes in both 2024 and 2025, more than double historical norms.
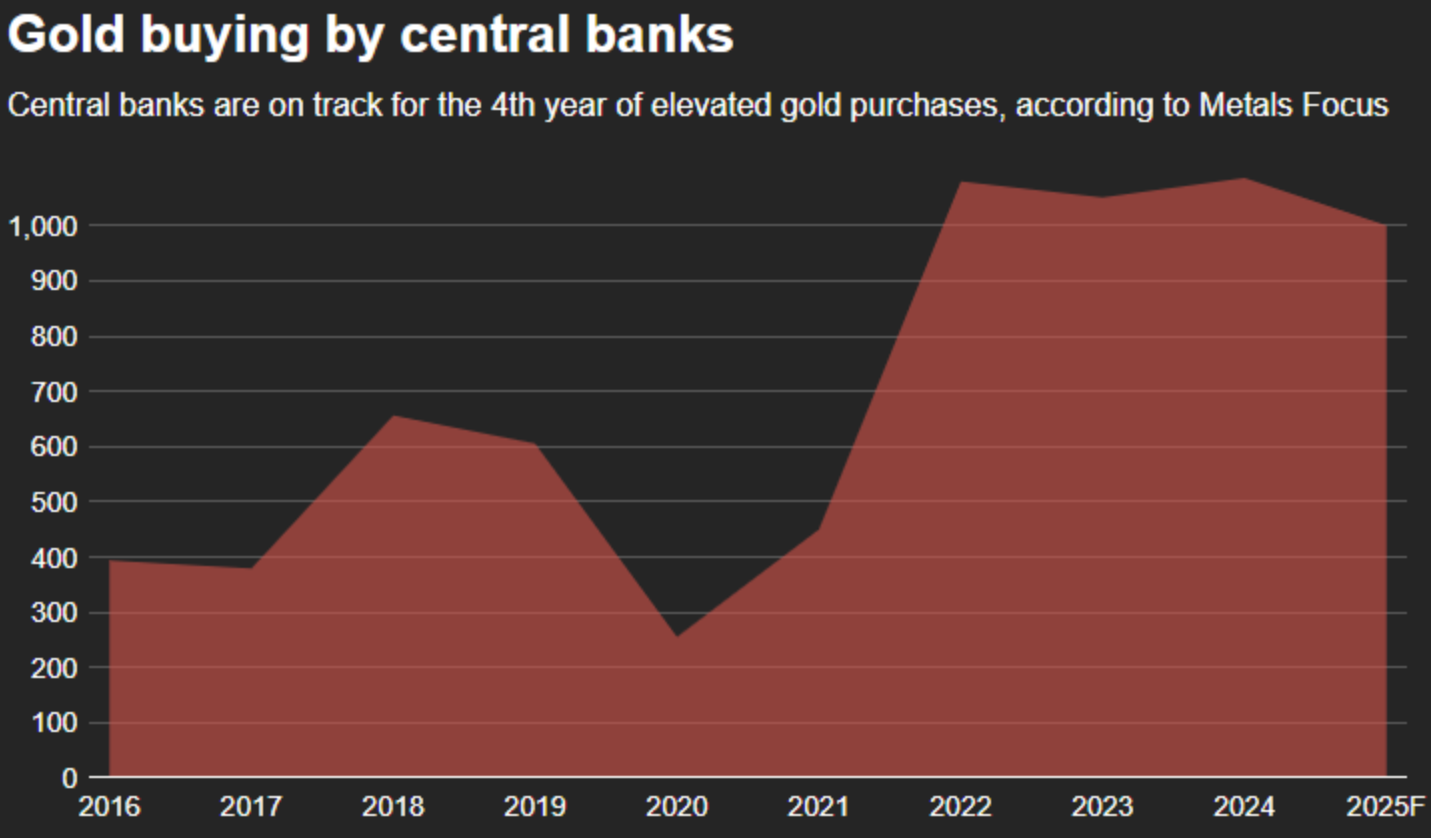
The catalyst was clear. The freezing of Russia’s foreign exchange reserves highlighted the fragility of fiat-denominated assets and reinforced gold’s role as a reserve asset free from political or counterparty risk.
Investment flows have added further momentum. After several years of ETF outflows, gold-backed funds saw a sharp reversal in 2025, with inflows exceeding those seen during the global financial crisis and approaching levels last recorded during the pandemic. At the same time, physical markets tightened, particularly across Asia, where buyers responded to visible scarcity rather than speculative enthusiasm.
Why it matters
Gold’s move above $5,000 is not simply a reflection of commodity dynamics - it signals a broader reassessment of risk. Confidence in traditional safe havens, especially government bonds, has weakened as debt burdens expand and real yields fail to offset inflation and fiscal uncertainty. The long-held assumption that sovereign bonds are inherently “risk-free” is being questioned.
That shift has reshaped gold’s role in portfolios. As OCBC analysts recently observed, gold is increasingly viewed not just as a hedge against crises or inflation, but as a neutral store of value capable of performing across a range of macroeconomic environments. This helps explain why price pullbacks have been shallow and short-lived, even as gold trades at unprecedented levels.
Impact on markets and investors
The rally has spilled across the precious metals complex. As gold prices climbed, silver attracted greater investor interest as a more accessible entry point. Spot silver rose above $117 this week after briefly touching a record near $119, pushing gains for the year beyond 60%. Analysts at Standard Chartered expect another supply deficit in 2026, pointing to tight above-ground inventories as the main constraint.
Gold’s resilience has also been notable given conditions that would normally limit upside. The Federal Reserve held interest rates steady, while strong earnings from major US technology firms supported risk appetite and the dollar. Yet gold remained firm, suggesting that monetary policy alone no longer dictates price direction.
Institutional positioning reinforces this interpretation. Several crypto-focused investment groups have announced plans to allocate up to 15% of portfolios to physical gold, blending digital and traditional stores of value. The tone of these flows is defensive and strategic, rather than momentum-driven.
Expert outlook
The speed of the advance implies higher volatility ahead. Analysts caution that gold’s steep ascent increases the risk of short-term pullbacks as positioning becomes stretched. Still, most view any correction as a consolidation phase rather than a signal of exhaustion, given the strength of underlying demand.
Longer-term comparisons provide perspective. In the late 1970s, gold’s most explosive gains occurred late in the cycle, with prices rising more than 120% in a single year. When the current bull market is overlaid on that period on a logarithmic scale, the alignment suggests a possible range of $8,700–$9,000 before the end of 2026. This is not a forecast, but a scenario grounded in sustained demand growth and structurally constrained supply.
Key takeaway
Gold above $5,000 does not signal an exhausted rally - it highlights how outdated many valuation models have become. Demand from central banks and investors continues to overwhelm limited supply, while confidence in fiat-based assets erodes. Volatility is likely to persist, but the forces driving gold higher are structural, global, and deeply entrenched. The defining question now is whether those pressures intensify as markets move further into 2026.
Gold technical outlook
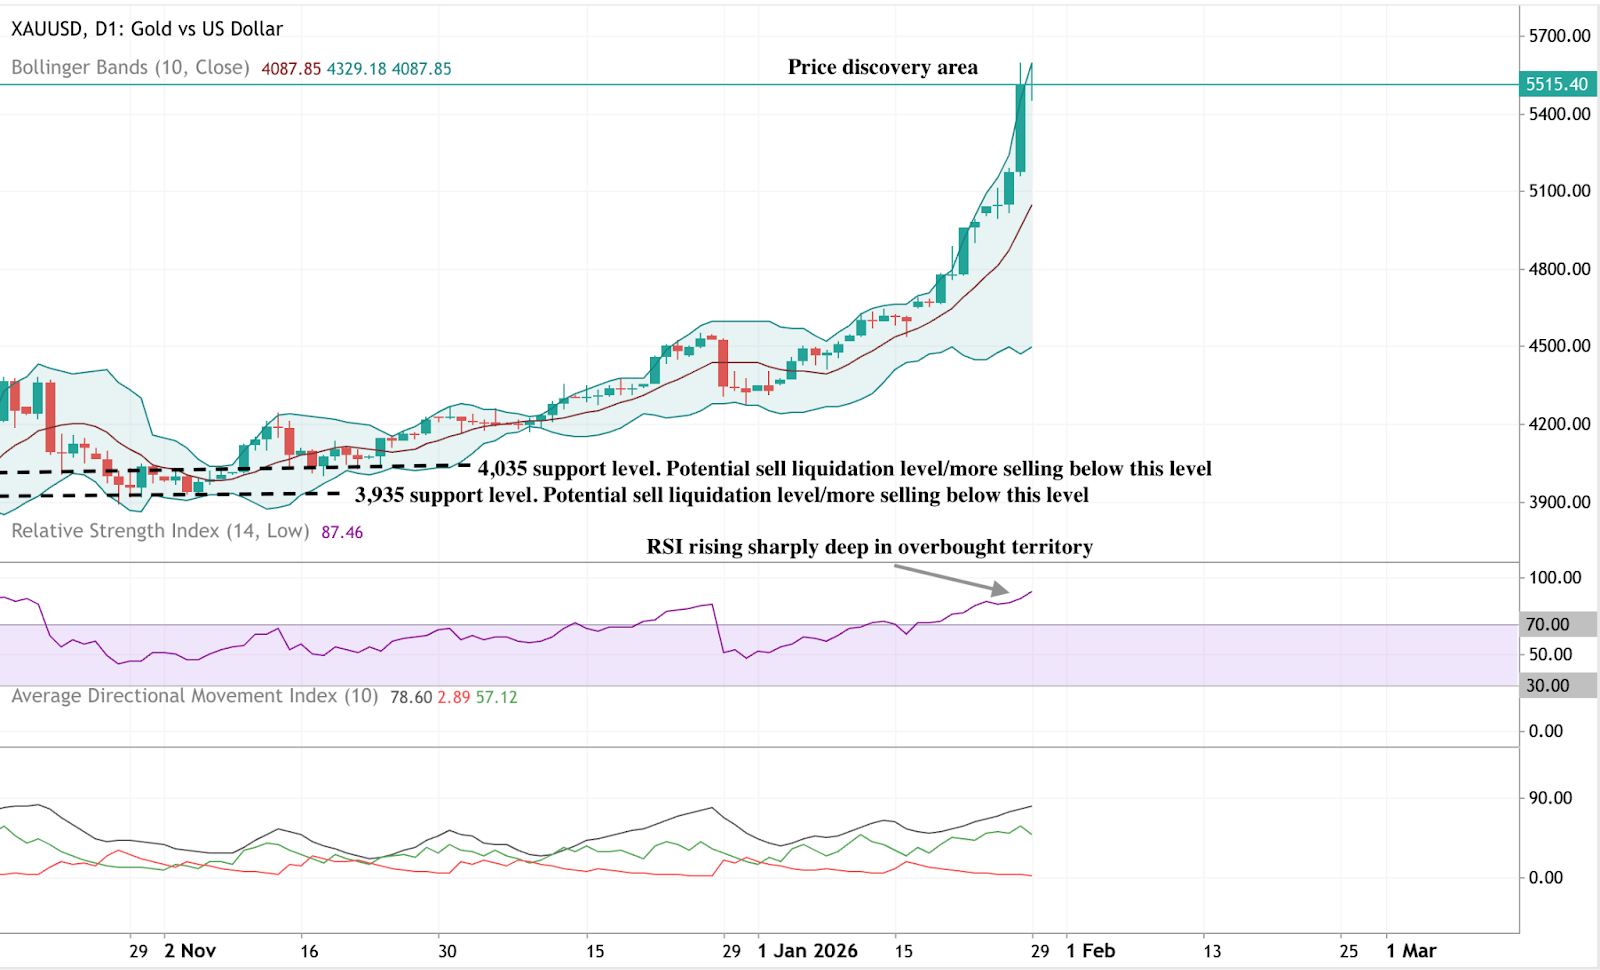
Gold has accelerated further into price discovery, extending to new highs above the US$5,500 area and continuing to trade along the upper Bollinger Band. The Bollinger Bands remain widely expanded, highlighting sustained volatility and persistent directional momentum following the latest surge.
Momentum indicators signal extreme conditions: the RSI is rising sharply and remains deep in overbought territory, while the ADX is exceptionally elevated, indicating a very strong, mature trend phase. Structurally, price remains far above earlier consolidation zones around $4,035 and $3,935, underscoring the magnitude and persistence of the advance. Overall, the chart depicts an extended momentum-driven environment characterised by strong trend intensity, elevated volatility, and active price discovery.
Disclaimer:
The information contained on the Deriv Market News is for educational purposes only and is not intended as financial or investment advice. The information may become outdated, and some products or platforms mentioned may no longer be offered. We recommend you do your own research before making any trading decisions. The performance figures quoted refer to the past, and past performance is not a guarantee of future performance or a reliable guide to future performance.
FAQs
Why is gold rising even though interest rates are steady?
Is gold overvalued at above $5,000?
Why is silver rallying alongside gold?
Could gold see a sharp correction?
What data points matter next for gold?


