Contents
Article
Why a Wall Street veteran warns of a 50% silver drop as Citi eyes $150
January 28, 2026
Article
Why a Wall Street veteran warns of a 50% silver drop as Citi eyes $150
January 28, 2026
Article
Why a Wall Street veteran warns of a 50% silver drop as Citi eyes $150
January 28, 2026

Silver’s recent move has gone far beyond a typical rally. Prices have surged almost threefold in roughly a year, breaking decisively above $100 per ounce and reaching levels few thought possible outside a crisis. Yet even as bullish forecasts multiply, one of Wall Street’s most prominent strategists is urging caution. Former JPMorgan chief strategist Marko Kolanovic argues that silver’s explosive rise carries the clear signature of a speculative blow-off, warning prices are “almost guaranteed” to fall by around 50%.
The clash between Kolanovic’s warning and Citi’s bullish $150 target captures the tension now gripping the silver market: is this the early stage of a new structural repricing, or the late phase of a momentum-driven surge that ends painfully?
How extreme is the silver rally?
Over the past twelve months, silver has climbed from the low-$30 range to record intraday highs near $115–$118 per ounce, translating into gains of roughly 250–270%. That performance has eclipsed gold and outpaced most major equity indices, turning silver into one of the standout assets of the year.
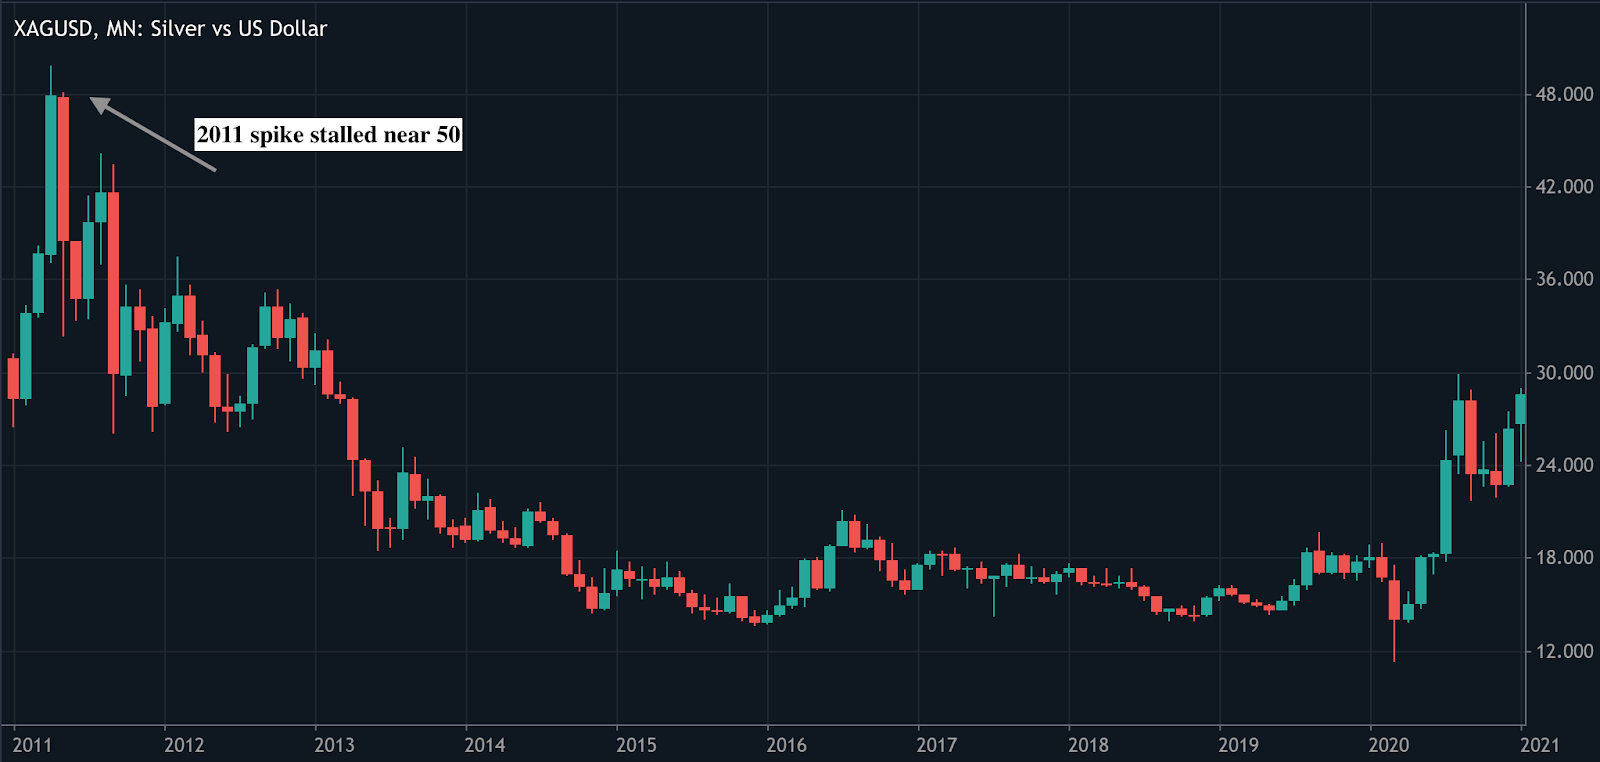
Citi notes that the move has pushed silver to an all-time intraday high around $117.7, while driving the gold-to-silver ratio below 50 - a sharp departure from long-term norms. For perspective, silver’s previous major peak in 2011 stalled near $50 before collapsing into a prolonged bear market. Today’s price levels are therefore unprecedented in nominal terms, underscoring the dramatic shift.
Market observers note that silver has morphed from a relatively quiet precious metal into a full-blown momentum trade. Daily price swings now routinely reach double-digit percentages, a pattern more typical of late-cycle commodity booms where sentiment and positioning overwhelm slower-moving fundamentals.
The bear case: Kolanovic’s “almost guaranteed” 50% crash
Kolanovic’s message is stark. He argues that silver is “almost guaranteed to drop ~50% from these levels within a year or so,” describing the rally as a textbook speculative excess rather than a fundamentally anchored move.
In his view, the surge has been fuelled by momentum chasing, fear-based macro positioning, and retail-style trading behaviour, not a step-change in underlying supply-demand dynamics. Silver, he suggests, is behaving less like a defensive store of value and more like a leveraged macro instrument prone to violent reversals.
History supports the warning. Commodities that move in a parabolic pattern tend not to drift sideways; they usually correct sharply once positioning becomes crowded and marginal buyers step away. Silver’s collapse after 2011 and the boom-bust cycles of the 1970s are often cited as reminders that deep drawdowns can follow euphoric peaks without invalidating longer-term themes.
Kolanovic also highlights a key constraint unique to commodities: physical reality. Sustained high prices eventually curb industrial demand, accelerate recycling, and encourage producers to hedge or expand supply, setting the stage for mean reversion.
The bull case: Citi’s $150 target and “gold on steroids”
Citi, however, sees further near-term upside. The bank has lifted its 0–3 month silver price target to $150 per ounce, implying another 30–40% potential gain from recent levels. Citi commodities strategist Maximilian Layton describes silver’s behaviour as “gold squared” or “gold on steroids,” reflecting its tendency to amplify macro fear trades.
Citi acknowledges that the rally is being driven primarily by capital flows and speculative demand rather than classic fundamentals. Even so, the bank argues those flows have not yet reached levels that historically signal exhaustion, particularly when silver is assessed relative to gold.
The bank points to several tailwinds: elevated geopolitical tensions, renewed debate around Federal Reserve independence, and strong speculative and investment demand, particularly from China and other parts of Asia. Analysts also note tight physical supply conditions outside the US, with elevated premiums in key markets and expectations of persistent deficits in the coming years. In this framework, silver could overshoot further before any meaningful cooling sets in.
Industrial demand, solar, and the substitution risk
Beyond the speculative narrative, silver remains a critical industrial input. Industrial uses account for roughly 58% of global silver demand, spanning renewable energy, electronics, and automotive applications.
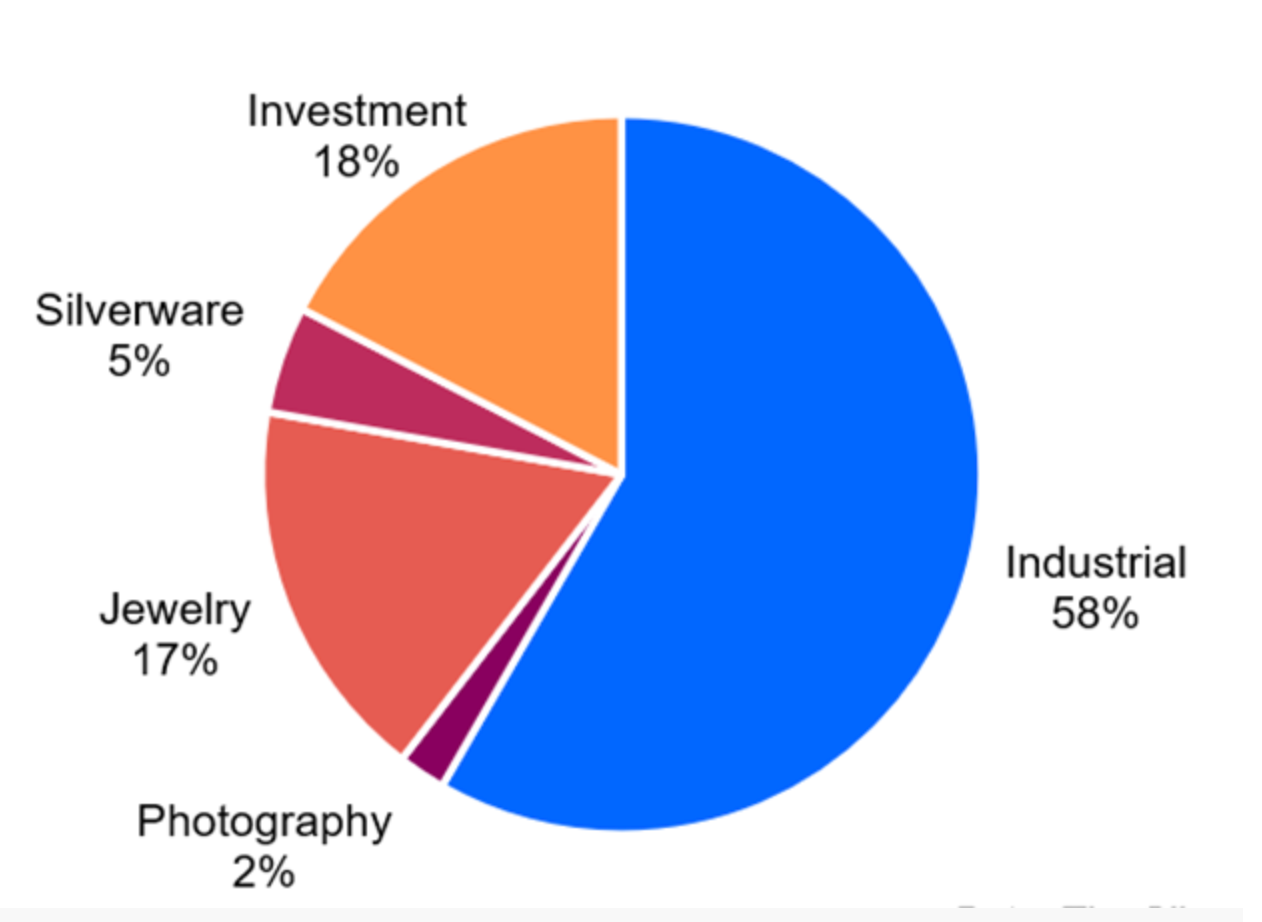
The Silver Institute and Metals Focus estimate industrial demand could approach 700 million ounces, with solar power playing a central role. Silver’s unmatched conductivity makes it essential for photovoltaic cells, and recent figures suggest that solar demand alone may account for close to one-fifth of total silver consumption, nearly double its share in 2022.
Yet today’s prices are already triggering behavioural shifts. High costs are accelerating efforts to reduce silver usage, particularly in solar manufacturing. Industry reports indicate that major producers such as LONGi are actively cutting silver loadings, experimenting with copper-based alternatives and other technologies to limit exposure. This dynamic creates a feedback loop: strong green-economy demand supports prices, but elevated prices also encourage substitution and demand destruction - precisely the risk highlighted by bearish strategists.
Positioning, ETFs, China and the new momentum trade
This rally differs from past cycles in that the speculative pressure originates. Citi notes that traditional warning signs - such as declining global silver ETF holdings or softer COMEX positioning - have failed to halt the advance, suggesting much of the demand is coming from Asian futures and OTC markets rather than Western investment vehicles.
Coverage of the surge highlights the role of Chinese retail traders, prompting local authorities to step in by tightening trading conditions, raising futures margins, and restricting new subscriptions to a major domestic silver ETF.
While Western products such as iShares Silver Trust, Aberdeen Standard Physical Silver, and Sprott Physical Silver Trust remain relevant, they no longer appear to be the marginal driver of price. Kolanovic, however, still views silver ETFs as crowded macro trades vulnerable to abrupt unwinds. The emergence of bearish ETF-linked strategies reflects a market deeply divided but united on one point: positioning is extreme, and price moves could be violent in either direction.
What a 50% drawdown or a spike to $150 could mean
A 50% correction, as Kolanovic suggests, would take silver from roughly $110–$115 back toward the $50–$60 range by late 2026. Such a move would punish late-cycle buyers and high-cost producers, but it would not be unusual by historical standards. It could also ease pressure on industrial users, slow substitution efforts, and allow the market to rebuild a more sustainable base.
If Citi’s bullish scenario unfolds instead, a surge toward $150 would further compress the gold–silver ratio and reinforce silver’s role as the high-beta expression of macro anxiety and liquidity flows. Yet such prices would likely provoke stronger policy responses, tighter trading conditions, and intensified efforts to engineer silver out of industrial processes. Even Citi cautions that sharp gains could be followed by heightened volatility.
Key takeaway
Silver now stands at a crossroads between momentum and mean reversion. Citi sees powerful macro flows, tight supply, and speculative demand driving prices toward $150, while Marko Kolanovic warns that parabolic moves in commodities often end with brutal corrections of 50% or more.
For traders and investors, silver is no longer a passive inflation hedge. It has become a high-octane macro asset, where timing, positioning, and risk discipline matter as much as the broader narrative.
Silver technical outlook
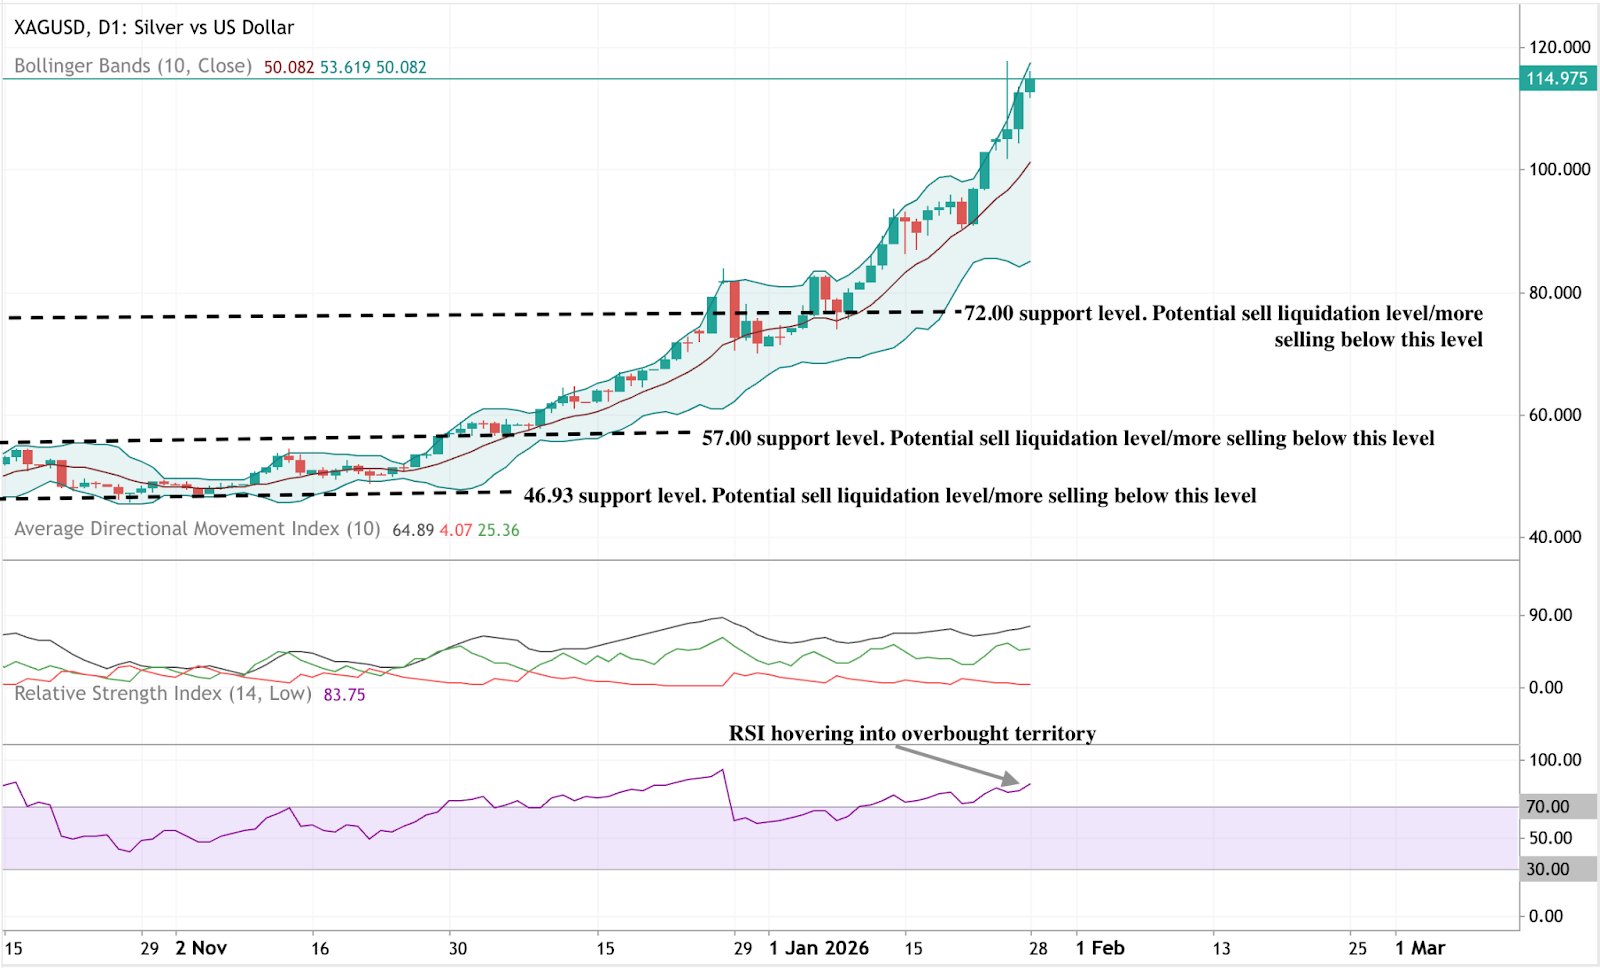
Silver continues to push into uncharted territory, hugging the upper Bollinger Band amid elevated volatility. The wide expansion of the bands signals a market still in an accelerated, high-energy phase following the recent surge.
Momentum indicators remain stretched. The RSI sits deep in overbought territory, while the ADX points to a strong but mature trend. Structurally, prices are far above former consolidation zones near $72, $57, and $46.93, highlighting just how extended the move has become.
Disclaimer:
The information contained on the Deriv Market News is for educational purposes only and is not intended as financial or investment advice. The information may become outdated, and some products or platforms mentioned may no longer be offered. We recommend you do your own research before making any trading decisions." is present but requires tailoring. The performance figures quoted refer to the past, and past performance is not a guarantee of future performance or a reliable guide to future performance.
FAQs
Why does Marko Kolanovic believe silver prices could fall by 50%?
How extreme has the recent silver rally been?
Why is Citi targeting a silver price of $150 per ounce?
How important is industrial and solar demand to silver prices?
What role are China and investor positioning playing in the silver rally?


