Contents
Article
An ounce of silver now costs more than a barrel of oil!
December 22, 2025
Article
An ounce of silver now costs more than a barrel of oil!
December 22, 2025
Article
An ounce of silver now costs more than a barrel of oil!
December 22, 2025
.webp)
On 22 December 2025, global commodity markets reached a striking milestone. Silver climbed to roughly $67-68 per troy ounce, overtaking the price of a barrel of West Texas Intermediate crude, which hovered near $56-57. Even Brent crude, trading closer to $60-61, failed to reclaim the symbolic lead, according to reports.
In simple terms, one ounce of silver was suddenly worth more than 42 gallons of crude oil.
This price inversion is rare. The last comparable episode dates back more than forty years to the late 1970s and early 1980s, when inflation shocks and speculative excess briefly sent silver soaring past oil. What makes the current crossover notable is that it appears less driven by speculation and more by structural forces reshaping global supply and demand.
The relationship first began to flip earlier in 2025 when silver pushed above $54 while oil remained capped in the $65-75 range. By December, the divergence had widened enough for analysts to label it a defining macro signal - one that reflects shifting priorities in energy, technology and capital allocation.
What’s fueling silver’s explosive rally?
Silver has delivered one of its strongest performances in decades, rising by roughly 125–130% year to date and reaching new all-time highs, according to data. While gold has also rallied strongly, silver has clearly outpaced it, highlighting its dual role as both a store of value and a critical industrial input.
At the heart of the rally lies a persistent supply imbalance. Reports showed global mine output has struggled to grow, while recycling volumes remain insufficient to close the gap. As a result, the silver market is on track for its fifth consecutive annual deficit, estimated at 95-149 million ounces for 2025. Cumulative shortfalls since 2021 now exceed 800 million ounces, pushing above-ground inventories towards multi-decade lows.
Industrial demand has been the main catalyst. More than 60% of silver consumption now comes from industrial uses, particularly in technologies tied to the energy transition:
- Solar energy: Photovoltaic installations consume hundreds of millions of ounces annually. Each panel requires silver for its conductive properties, and ambitious renewable targets across Europe, China and the US continue to underpin demand.
- Electric vehicles: EVs use roughly twice as much silver as internal combustion vehicles, across batteries, power electronics and charging infrastructure. Automotive silver demand is expected to continue growing steadily over the next decade.
- Electronics and AI infrastructure: Data centres, semiconductors, 5G networks and AI-driven power systems are adding further structural demand.
In other reports, macro conditions have amplified these fundamentals. Expectations of continued Federal Reserve easing, a weaker US dollar, and persistent geopolitical uncertainty have boosted silver’s appeal as both an industrial asset and a monetary hedge. Its inclusion on the US critical minerals list has further reinforced institutional interest, framing silver as a strategic component of the green economy.
Why is oil struggling to keep up?
Crude oil has experienced a very different year. WTI prices are down roughly 18–20% in 2025, putting oil on course for its weakest annual performance since the pandemic shock of 2020.
The primary issue is oversupply, according to analysts. Output from non-OPEC producers, led by US shale production at record levels, has continued to rise. Additional supply from countries such as Brazil and Guyana has added to the glut. At the same time, OPEC+ has gradually relaxed voluntary production cuts, increasing daily supply into an already well-stocked market.
Global inventories have reportedly risen sharply since mid-year, and demand growth has been unable to absorb the excess. Consumption in China has been uneven, while demand across Europe and the US has softened amid efficiency gains and slower economic momentum. Forecasts increasingly point to a persistent surplus extending into 2026, with some projections placing Brent crude closer to $55 if inventory builds continue.
Geopolitical tensions have produced short-lived price spikes, but they have not been enough to reverse the broader downtrend in a market defined by ample supply.
Why this inversion matters: A window into global shifts
Market watchers note the silver-over-oil crossover is more than a statistical curiosity. It serves as a macro barometer for how global markets are evolving.
At its core, it reflects the energy transition in motion. Commodities linked to electrification, decarbonisation and advanced manufacturing are attracting capital, while traditional fossil fuels face headwinds from oversupply and long-term demand uncertainty. Silver, often described as a “new energy metal,” sits at the centre of this shift.
The narrowing gold–silver ratio, now near 70:1 compared with levels above 100:1 in recent years, suggests investors are increasingly pricing silver’s industrial growth potential alongside its monetary role.
There are historical echoes here. Commodity booms of the late 20th century were marked by sharp price distortions and heightened volatility. While today’s rally appears more fundamentally grounded, it still carries risks. Rapid price appreciation can leave markets vulnerable to corrections if growth expectations falter or liquidity tightens.
For investors, the message is clear: leadership within commodities is changing. Assets once seen as secondary are now outperforming long-established benchmarks, reshaping how portfolios are positioned for the future.
Looking ahead: Boom, bust, or new normal?
Silver’s outlook remains constructive as long as supply deficits persist and demand from clean energy and technology continues to expand. Some analysts see scope for prices to test $70–75 over the next year, although stretched momentum and thin year-end liquidity raise the risk of short-term pullbacks.
Oil may find support if production discipline improves or demand surprises to the upside, but current forecasts suggest pressure is likely to persist well into 2026.
Ultimately, 22 December 2025 may be remembered as more than a symbolic crossover. It marks a moment when markets clearly signalled a reordering of priorities - one increasingly shaped by sustainability, technology and resilience. In that context, silver’s shine may prove more enduring than oil’s dominance.
Technical insights
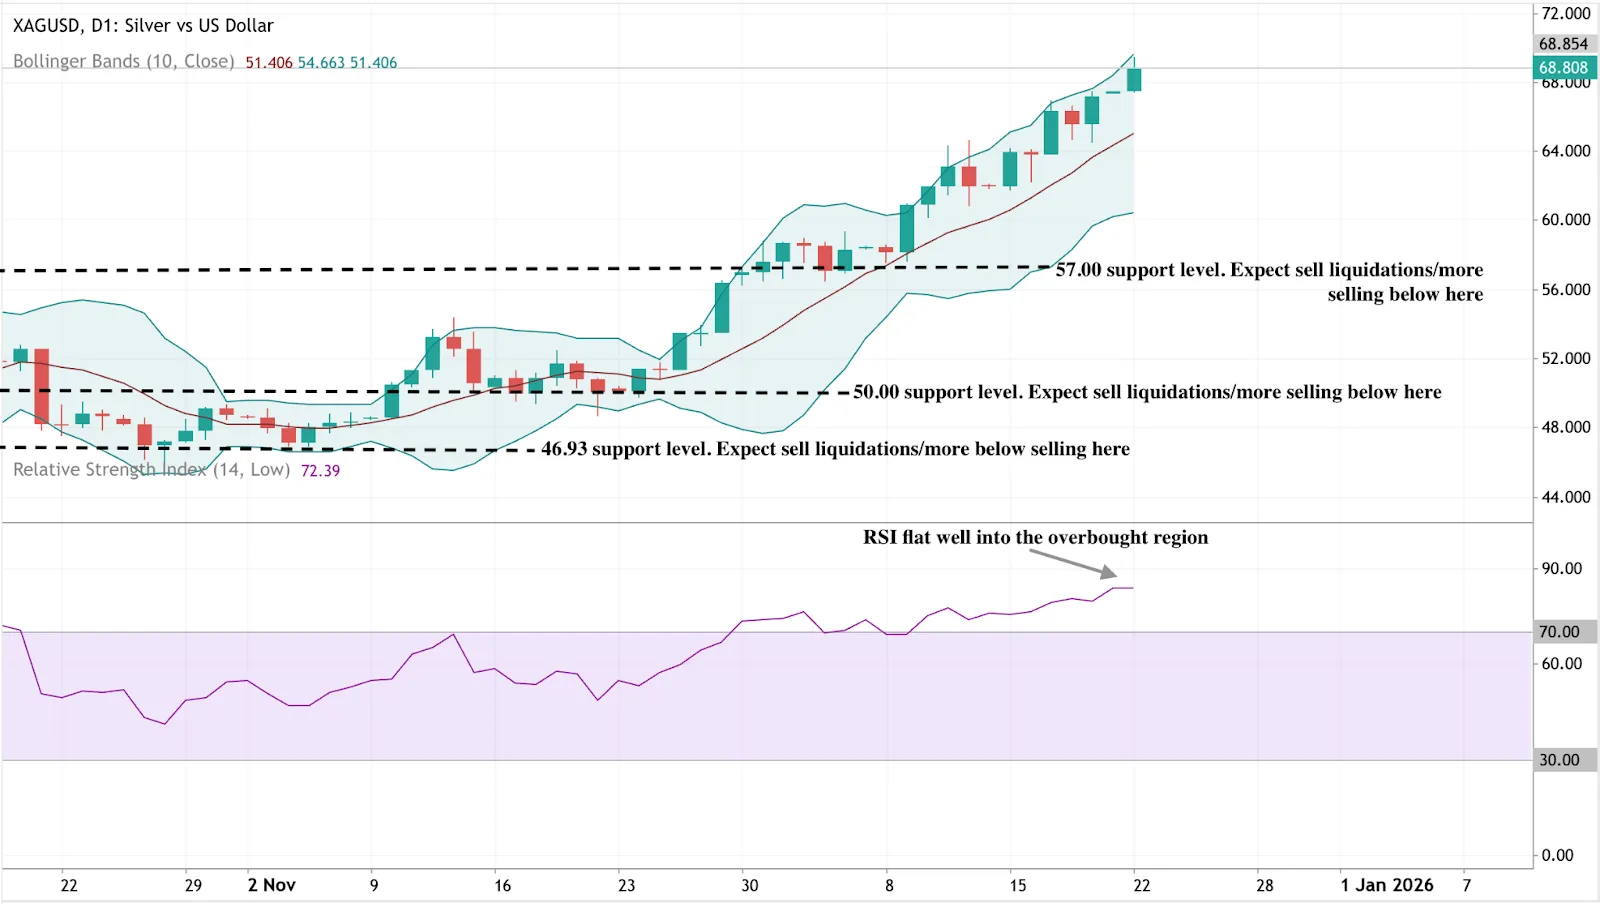
Silver remains firmly in a bullish structure, with price tracking close to the upper Bollinger Band. This reflects strong upside momentum, although it also suggests conditions are stretched and vulnerable to consolidation.
Key downside levels sit at $57.00, followed by $50.00 and $46.93. A sustained break below these zones would likely trigger a deeper corrective phase. Momentum indicators remain elevated, with the RSI remaining in overbought territory, which is supportive of the trend but signals that further gains may require a pause or reset.
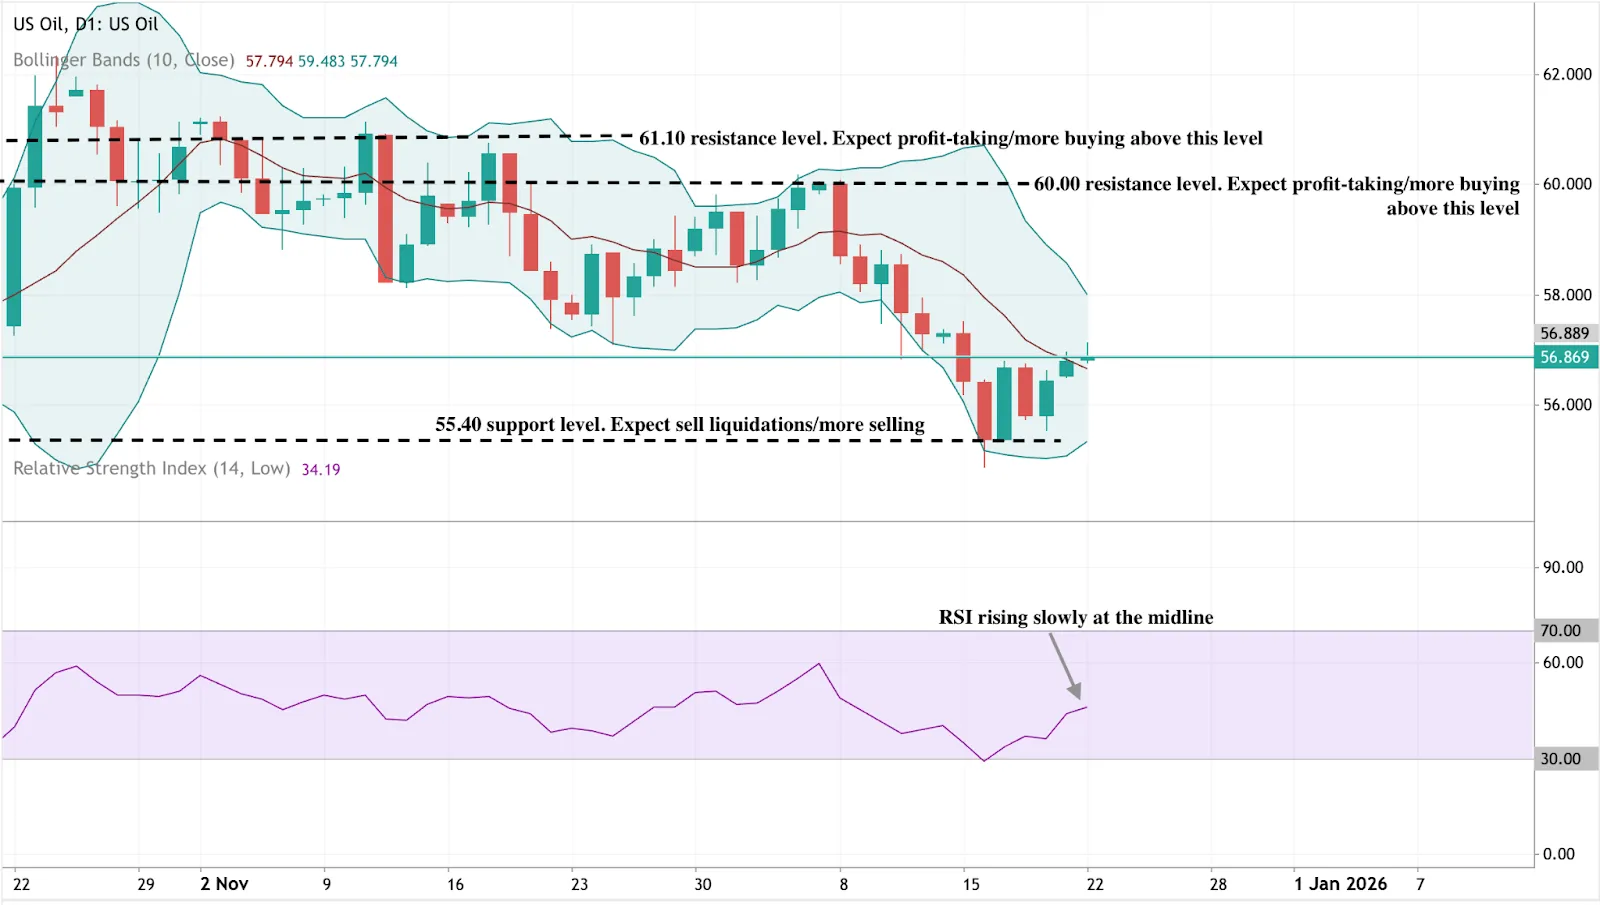
US oil continues to trade under pressure, with prices capped below the $60.00–$61.10 resistance area and constrained by the upper Bollinger Band. The broader structure still indicates a corrective phase, although the selling momentum has begun to slow.
On the downside, $55.40 remains the key level to watch. A decisive break could open the door to renewed liquidation. The RSI has begun to recover from oversold conditions, indicating that downside pressure is easing, but bullish conviction remains limited.
Disclaimer:
The performance figures quoted are not a guarantee of future performance.
FAQs
What’s the gold-silver ratio telling us?
Why is silver demand exploding?
When did silver last trade above oil?


