Contents
Article
S&P 500 outlook: How much tight liquidity can markets handle?
February 5, 2026
Article
S&P 500 outlook: How much tight liquidity can markets handle?
February 5, 2026
Article
S&P 500 outlook: How much tight liquidity can markets handle?
February 5, 2026

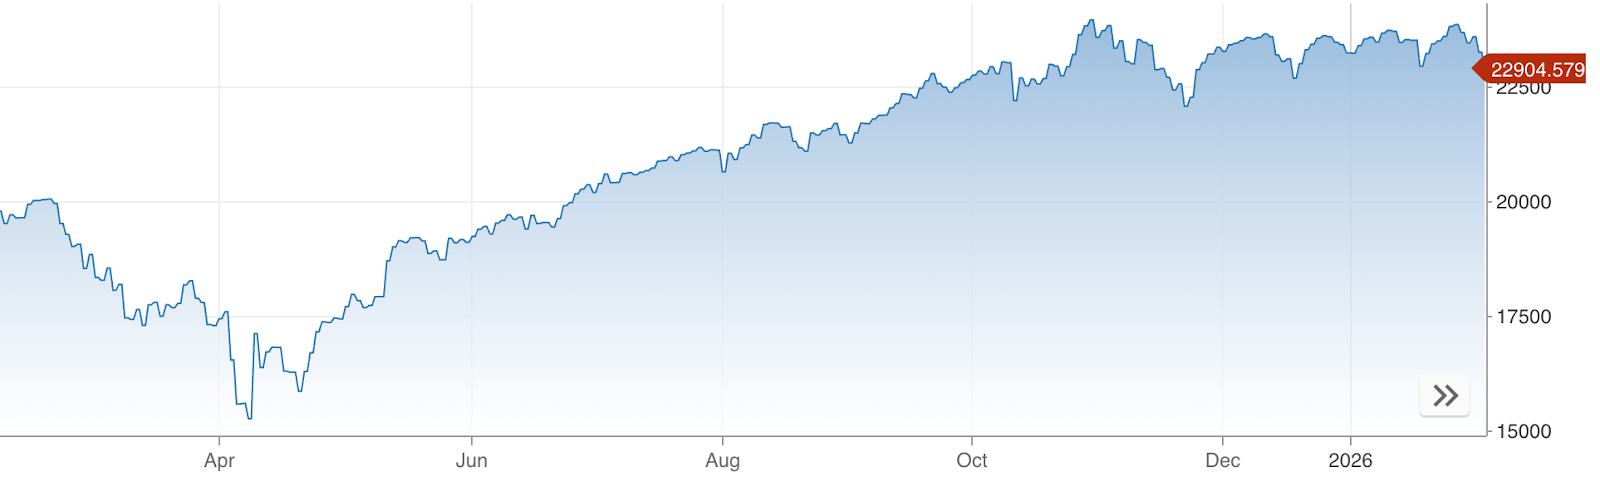
The answer appears to be yes - for now - but the strain is becoming more visible. The S&P 500 remains close to record highs, yet underlying liquidity conditions are tightening in ways that have historically capped equity upside. Recent price action suggests resilience, but also rising fragility beneath the surface.
Midweek trading highlighted this split clearly. The headline index slipped around 0.5%, while the equal-weighted S&P 500 climbed close to 0.9%. That gap pushed market dispersion toward the upper end of its historical range, signalling that investors are becoming more selective rather than uniformly bullish.
This shift matters because liquidity has begun to overshadow earnings as the dominant market driver. With reporting season drawing to a close, long-term bond yields hovering near key resistance, and the US Treasury preparing to absorb cash from the system, the market’s ability to cope with tighter conditions will shape the S&P 500’s next phase.
What’s driving the S&P 500 outlook?
Recent trading shows a market moving in opposing directions at once. Mega-cap technology stocks have weighed on the headline index, while smaller names and more defensive sectors have edged higher. That divergence has driven a notable increase in dispersion, with the index rising to roughly 37.6 - a level more typical of peak earnings uncertainty than the closing stages of the season.
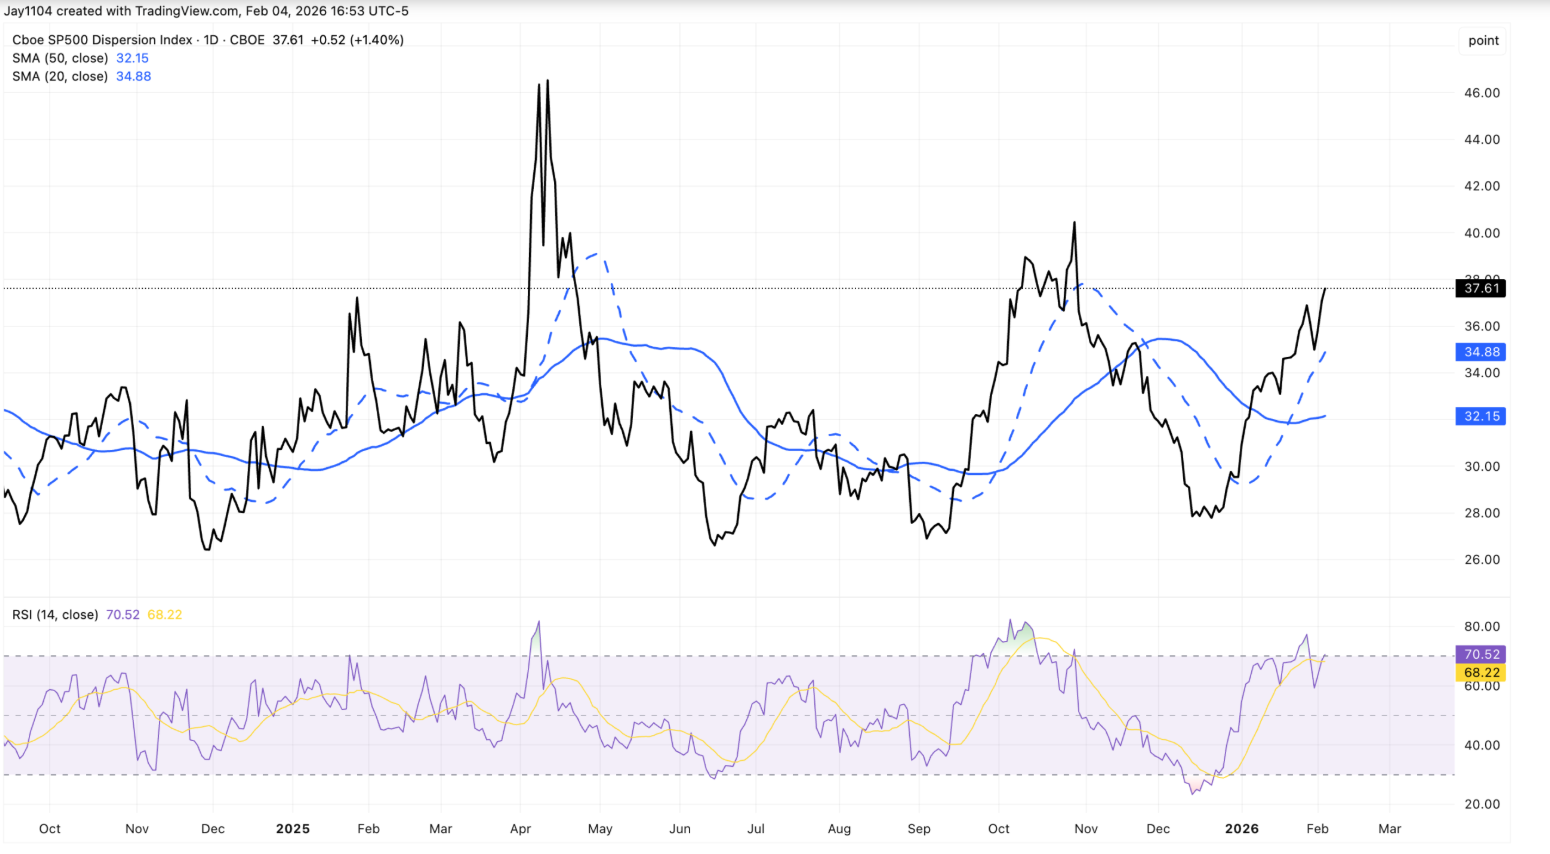
Much of this appears to be driven by positioning rather than by a clear shift in fundamentals. Implied volatility has risen faster than in previous quarters, prompting investors to favour companies with steadier earnings profiles. Walmart’s continued strength, despite its earnings still weeks away, fits this pattern. Rather than a classic rotation, the move echoes the dispersion trades seen ahead of major technology results.
Bond markets are adding to the uneasy tone. The US 30-year Treasury yield has crept back toward 4.9%, once again testing a ceiling that has held for several weeks.
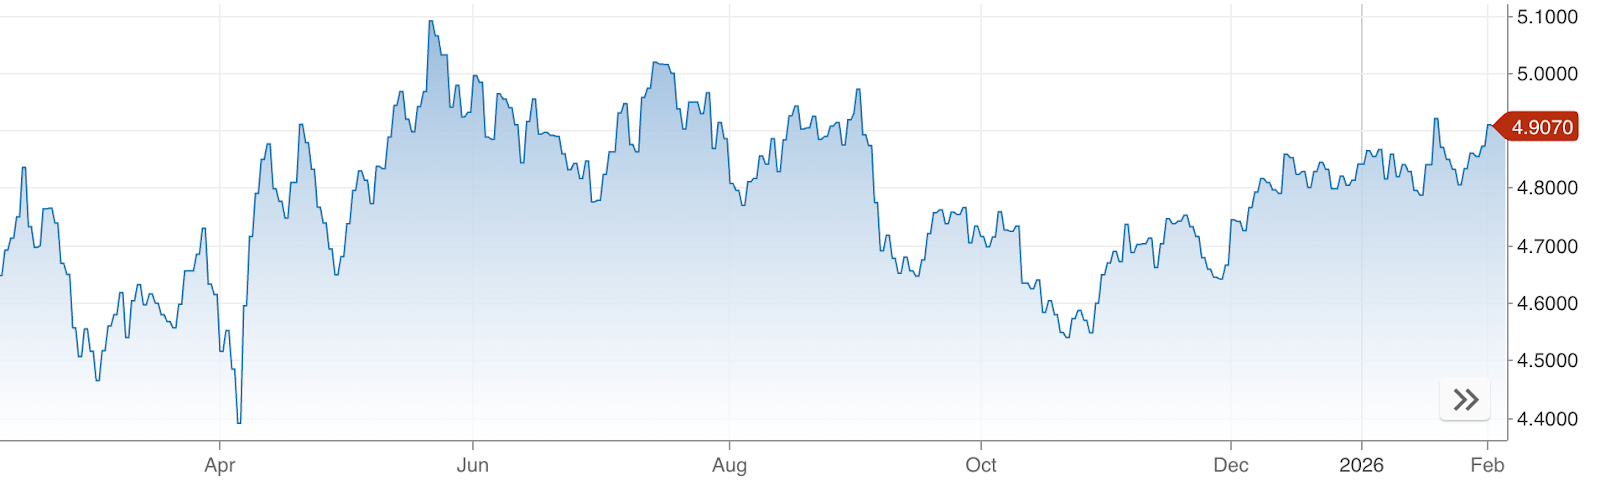
In normal conditions, strong growth, heavy issuance, and persistent deficits would likely have pushed yields higher by now. The fact that rates remain range-bound suggests liquidity constraints - rather than confidence - are exerting a stronger influence on market behaviour.
Why it matters
For investors, the widening gap between headline performance and internal market dynamics is a cautionary signal. When the S&P 500 appears stable while leadership narrows, markets tend to become more sensitive to shocks. Strength in the equal-weighted index alongside weakness in large caps points to selective de-risking rather than broad optimism.
Liquidity trends heighten that vulnerability. The US Treasury has indicated that the Treasury General Account could rise above $1 trillion around tax season, implying roughly $150 billion in additional liquidity being withdrawn from markets.
While increased Treasury bill issuance may ease the impact, it is unlikely to fully neutralise the drain. As Sonali Basak of iCapital observed, markets are not braced for disruption, but “liquidity is no longer providing the same support it did last year”.
Impact on markets and investors
The most visible consequence has been sharp sector rotation. Technology stocks, particularly software, led losses during the latest sell-off as concerns around AI disruption and stretched valuations triggered profit-taking. The Nasdaq Composite fell 1.5%, while the Dow Jones Industrial Average gained 0.5%, highlighting the uneven nature of market leadership.
Despite this, the broader AI investment story remains intact. Alphabet’s earnings pointed to capital expenditure rising to as much as $185 billion by 2026, supporting shares of Nvidia and Broadcom even as Alphabet itself slipped. The response suggests investors are reassessing near-term pricing rather than walking away from the theme altogether.
For longer-term participants, the main risk is complacency. If liquidity continues to tighten while yields remain stuck near resistance, volatility could re-emerge quickly once correlations rise and dispersion trades unwind.
Expert outlook
Looking ahead, many strategists expect dispersion to ease as earnings season concludes and short-term positioning is unwound. Historically, correlations tend to rise once earnings uncertainty fades, bringing sector performance back into closer alignment. Even without a macro shock, that adjustment alone could lift volatility.
The larger uncertainty remains liquidity. Weekly jobless claims, Amazon’s earnings, and updates on Treasury funding will be key markers. A sustained move above 5% in the 30-year yield would likely weigh on equity valuations, while continued rate stagnation may point to deeper stress in funding markets. For now, the S&P 500 appears capable of absorbing tighter liquidity - but only as long as confidence holds.
Key takeaway
The S&P 500 is coping with tighter liquidity, but the buffer is thinning. Rising dispersion, stubborn bond yields, and looming cash withdrawals suggest headline stability may be misleading. As earnings fade from the spotlight, liquidity conditions will take centre stage. The market’s next decisive move is likely to be driven less by profits and more by funding dynamics.
Disclaimer:
The information contained on the Deriv Market News is for educational purposes only and is not intended as financial or investment advice. The information may become outdated, and some products or platforms mentioned may no longer be offered. We recommend you do your own research before making any trading decisions. The performance figures quoted refer to the past, and past performance is not a guarantee of future performance or a reliable guide to future performance.
FAQs
Can the S&P 500 rally with tightening liquidity?
Why is the equal-weighted S&P 500 outperforming?
Are rising bond yields the main risk to equities?
Is the AI trade losing momentum?
What should investors watch next?


