Contents
Article
Bitcoin’s tariff shock deepens: Pullback or structural shift?
January 21, 2026
Article
Bitcoin’s tariff shock deepens: Pullback or structural shift?
January 21, 2026
Article
Bitcoin’s tariff shock deepens: Pullback or structural shift?
January 21, 2026
.jpg)
Bitcoin’s tariff-driven sell-off has gathered pace, sharpening the central question facing markets. What started as a geopolitical headline has evolved into a broader deleveraging event. On Wednesday, Bitcoin fell another 4% to around $88,000, extending losses as risk aversion rippled through equities, bonds, and currencies. Over the past 24 hours alone, total crypto liquidations climbed beyond $1.07 billion, highlighting just how abruptly positioning has been unwound.
This renewed weakness reflects a wider reassessment of US-linked risk. Gold surged to fresh record highs, the dollar softened, and Wall Street suffered its sharpest decline in months. Against that backdrop, Bitcoin is no longer reacting in isolation. Instead, it is being tested as part of a wider macro repricing, with investors questioning how it behaves when confidence in US assets deteriorates.
What’s driving Bitcoin’s moves?
The core catalyst remains President Donald Trump’s escalating tariff threat against eight European countries, linked to his demand that the US secure control over Greenland. This week, Trump reinforced the stance, stating there was “no going back”, reviving fears that trade tensions could spiral into a broader confrontation. Markets, already stretched, responded by cutting exposure aggressively.
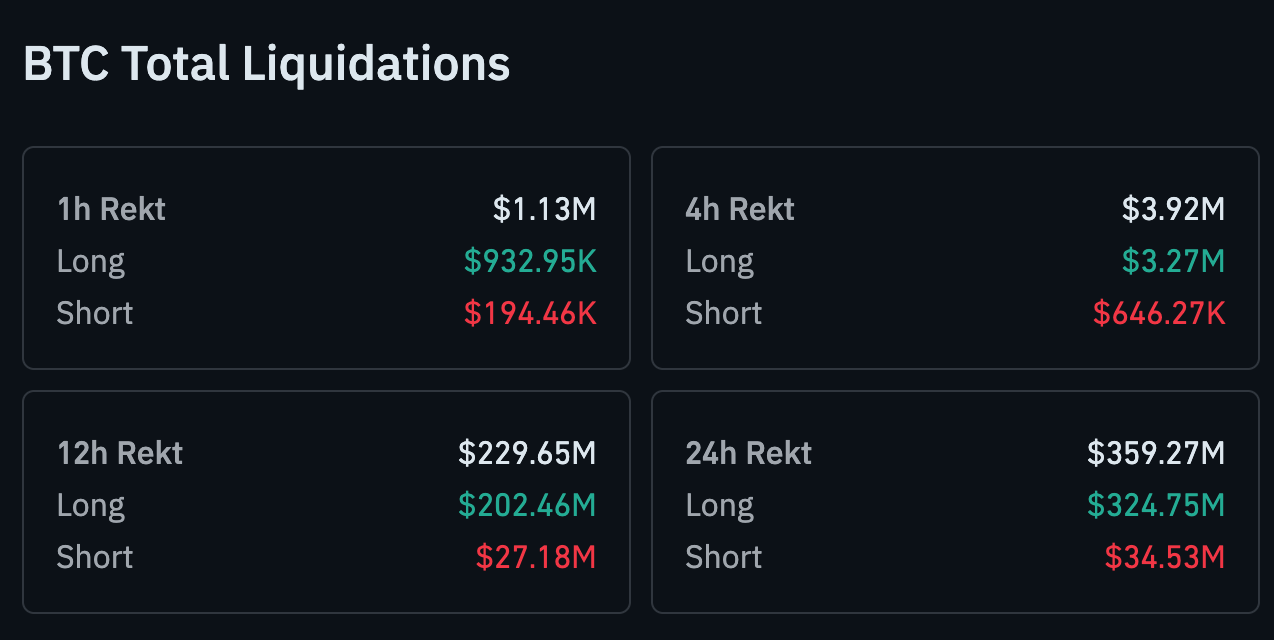
Within crypto markets, leverage again proved to be the pressure point. CoinGlass data shows that $359.27 million in Bitcoin positions were liquidated over the past 24 hours. The imbalance was stark: $324.74 million came from long positions, compared with just $34.53 million in shorts. That skew underscores how heavily traders were positioned for a rebound before sentiment flipped.
Why it matters
Bitcoin’s slide towards $88,000 underlines a familiar but uncomfortable truth for traders. During periods of macro stress, crypto remains closely aligned with global risk sentiment. As US equities sold off and the dollar weakened, Bitcoin followed the same risk-off trajectory rather than diverging, complicating the short-term hedge narrative.
The broader market context reinforces this dynamic. The S&P 500 fell 2.06% and the Nasdaq dropped 2.4% before futures steadied modestly. When equities, credit, and currencies are all under pressure at once, highly liquid and leveraged assets tend to absorb the shock first. Once again, Bitcoin has been treated as part of that high-beta group.
Impact on crypto markets and traders
The deeper sell-off has erased much of the confidence built earlier in January, when strong ETF inflows helped drive Bitcoin close to $98,000. The focus has now shifted decisively from upside participation to capital protection. Ether moved lower alongside Bitcoin, while liquidation volumes in smaller tokens remained comparatively muted, reflecting the concentrated positioning in the largest assets.
There is, however, a potential silver lining. Forced deleveraging often strips out fragile positioning. Analysts at CryptoQuant have previously noted that sharp liquidation phases can reduce the risk of cascading declines later by resetting leverage across the market. If macro conditions stabilise, a less crowded trade could offer more durable support, even if volatility remains elevated in the near term.
Gold surges as “Sell America” trade builds
As crypto faltered, traditional safe havens surged. Spot gold vaulted beyond $4,800 an ounce for the first time, with silver also hitting record highs, as investors sought shelter. Some strategists have described the move as a developing “Sell America” trade, characterised by falling equities, a weaker dollar, and rising precious metals.
Trade tensions sit at the heart of that shift. European policymakers are preparing countermeasures, with the EU convening an emergency summit in Brussels and considering retaliatory tariffs worth up to €93 billion ($109 billion) on US goods. The risk of tit-for-tat escalation adds another layer of uncertainty, keeping pressure on risk-sensitive assets such as Bitcoin.
Expert outlook
Technically, Bitcoin is under strain but has not yet broken decisively. The $90,000 region, previously a key support zone, is now under close scrutiny. Sustained weakness below this level would strengthen the argument for a deeper corrective phase rather than a simple pullback. Still, some analysts urge caution before declaring a trend reversal.
Robin Singh, CEO of crypto tax platform Koinly, points out that February has historically been one of Bitcoin’s strongest months, delivering average double-digit gains over the past decade. “But underperformance wouldn’t be surprising, and it’s not necessarily a bad thing,” he said, suggesting that a period of consolidation could recalibrate expectations without undermining the broader cycle.
Key takeaway
Bitcoin’s tariff shock has intensified, pulling prices down to $88,000 as leverage unwinds and macro stress spreads across markets. The move appears driven more by geopolitics and global risk aversion than by weaknesses unique to crypto. With gold surging and trade tensions escalating, Bitcoin finds itself caught in a wider market reset. Whether this develops into a deeper trend shift or remains a painful pullback will depend on how quickly macro uncertainty begins to fade.
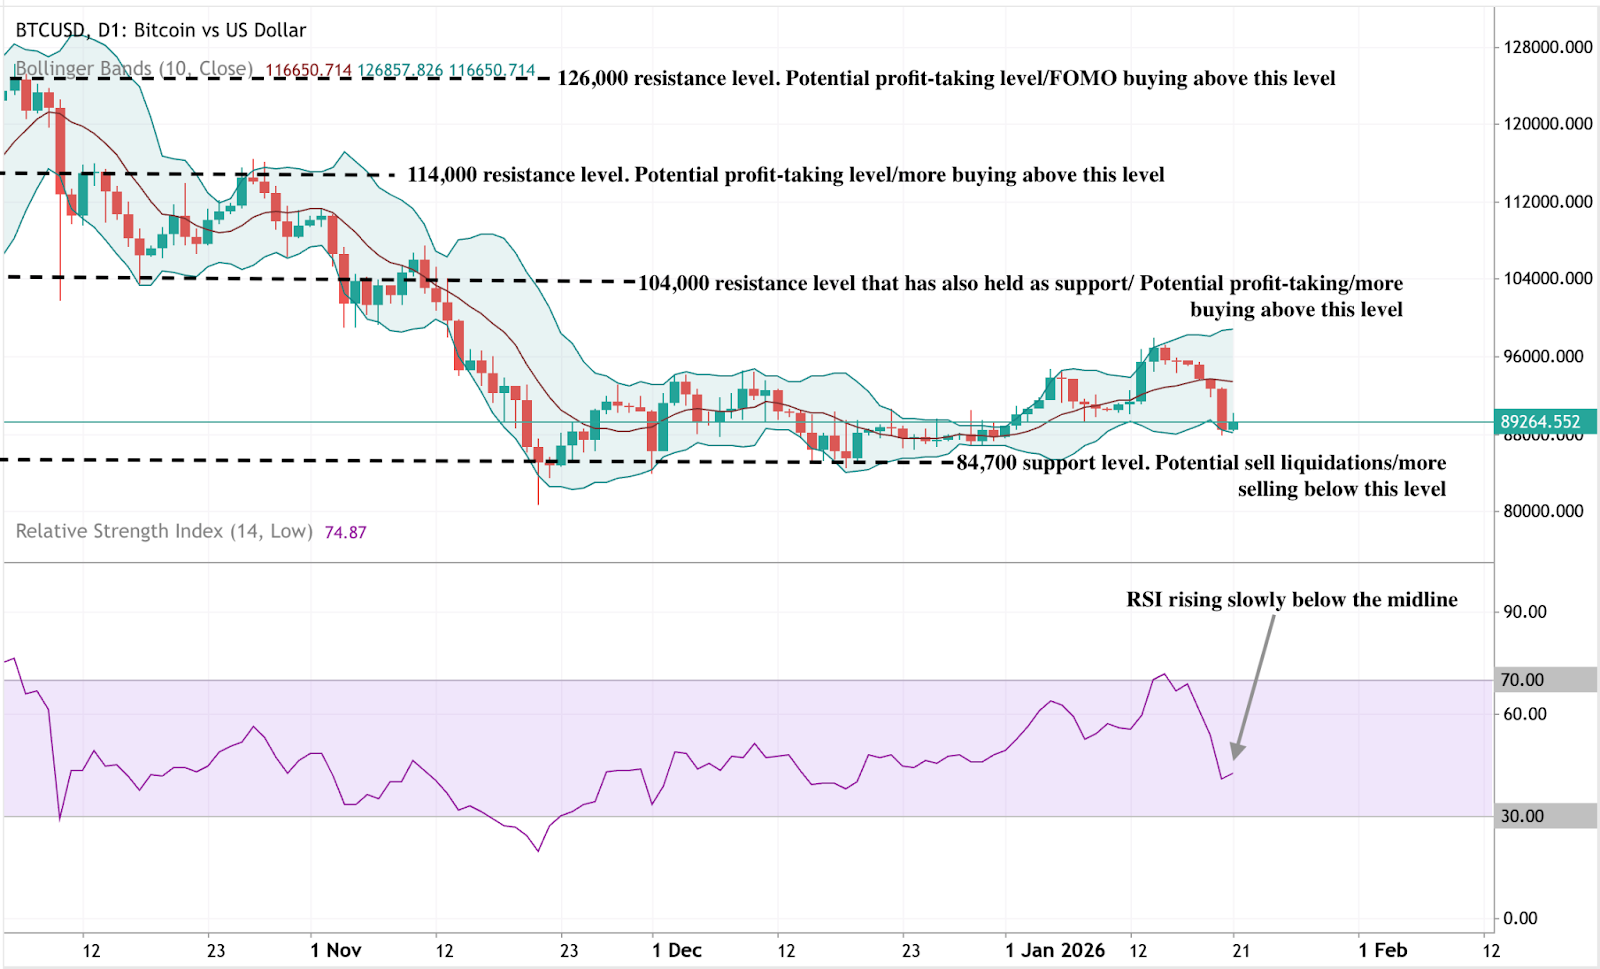
Bitcoin technical outlook
Bitcoin is consolidating after its sharp retreat from recent highs, with price holding within a defined range and remaining above the $84,700 area. Bollinger Bands have narrowed following a prior expansion, signalling a contraction in volatility as directional momentum slows.
Momentum indicators reflect this stabilisation phase. The RSI is edging higher but remains below the midline, pointing to improving momentum that has yet to regain former strength. Structurally, price action remains capped beneath former resistance zones near $104,000 and $114,000, suggesting the market is in a balancing phase rather than entering a fresh trend.
Disclaimer:
The information contained on the Deriv Market News is for educational purposes only and is not intended as financial or investment advice. The information may become outdated, and some products or platforms mentioned may no longer be offered. We recommend you do your own research before making any trading decisions.
FAQs
Why has Bitcoin fallen to $88,000?
How severe were the liquidations?
Why are gold and silver rising while Bitcoin falls?
Does this mean Bitcoin’s uptrend is over?
What level should traders watch next?


