Contents
Article
Santa Claus rally 2025: Is Wall Street in for a festive surprise?
December 22, 2025
Article
Santa Claus rally 2025: Is Wall Street in for a festive surprise?
December 22, 2025
Article
Santa Claus rally 2025: Is Wall Street in for a festive surprise?
December 22, 2025
%20(1)%20(1)%20(1)%20(1)%20(1)%20(1)%20(1)%20(1).webp)
It is December 2025. The Federal Reserve has just delivered its third interest rate cut of the year, yet the S&P 500 is struggling to find its footing. Investors are left wondering whether the usual year-end cheer has arrived late - or not at all.
As the calendar winds down, markets once again turn their attention to one of Wall Street’s most talked-about seasonal effects: the Santa Claus rally. It’s a brief but closely watched period that has historically coincided with optimism, lighter trading volumes, and a tendency for stocks to drift higher.
This year, however, softer economic data and a narrowing group of stocks driving returns have raised doubts about whether Santa will make an appearance.
What is the Santa Claus rally?
The Santa Claus rally refers to a seven-trading-day period that spans the final five trading sessions of December and the first two of January. According to the Stock Trader’s Almanack, the S&P 500 has posted average gains of roughly 1.2–1.3% during this period since 1950, outperforming the typical return seen across most calendar months.
The concept was first outlined in 1972 by Yale Hirsch, the founder of the Almanac. While it has earned a reputation for consistency, it is best viewed as a seasonal tendency rather than a certainty.
In 2025, the Santa Claus rally window runs from Wednesday, December 24, through Monday, January 5.
Why markets often rally at year-end
The Santa Claus rally does not hinge on a single catalyst. Instead, several seasonal forces often converge:
- Holiday optimism lifts investor sentiment
- Year-end bonuses are deployed into markets
- Tax-loss selling pressure fades
- Institutional participation declines, thinning liquidity
- Expectations themselves encourage buying activity
With fewer participants and lighter volumes, price movements can become exaggerated, allowing even modest inflows to push major indices higher.
When Santa doesn’t show, bears sometimes do
The Santa Claus rally carries weight not only when it occurs, but also when it doesn’t.
A long-standing Wall Street saying captures this idea:
“If Santa Claus should fail to call, bears may come to Broad and Wall.”
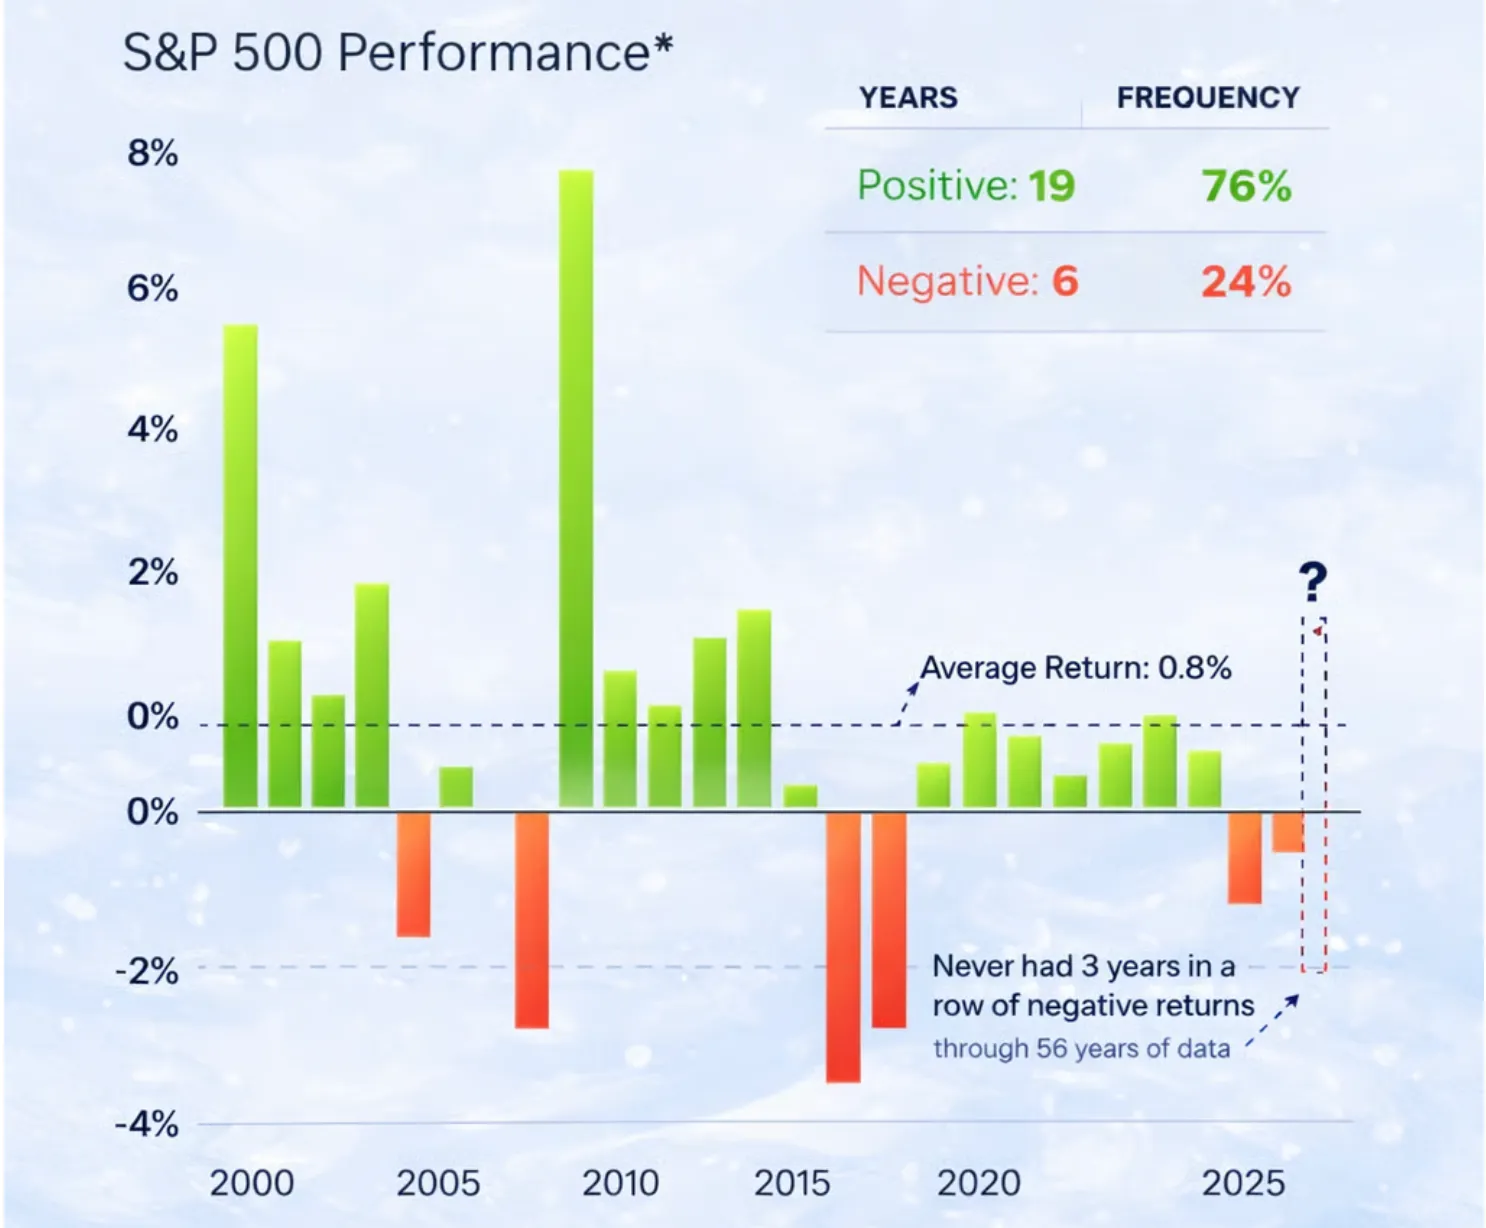
That said, history paints a more nuanced picture. Since 1969, the S&P 500 has recorded negative returns during the Santa window on 14 occasions. In those instances, the market ended the following year lower just four times, suggesting the signal is more reflective of sentiment than predictive power.
Still, the odds favour Santa’s arrival. According to reports, the rally has appeared roughly 76% of the time since 2000, well above the probability of gains during a typical seven-day trading stretch.
This year’s backdrop is notably mixed.
On the one hand, reports suggest that US labour market data has cooled, indicating a moderation in economic momentum. Equity gains have also become increasingly concentrated among a small group of large-cap stocks, leaving the broader market more vulnerable to shifts in sentiment.
On the other side stands the Federal Reserve.
With three rate cuts already in place and markets expecting additional easing in 2026, financial conditions are becoming more accommodative. History suggests that resisting a dovish Fed is rarely a profitable strategy - especially during low-liquidity periods such as the final weeks of the year.
That policy support may be enough to keep risk appetite alive, even if confidence remains fragile.
Santa is festive, not flawless
Seasonal patterns can be helpful, but they are far from foolproof.
The Santa Claus rally failed to materialise in both 2023 and 2024, with the S&P 500 posting losses during the festive window last year. By contrast, the period from 2016 to 2022 saw consistent gains, with several years delivering returns above 1%.
Even in years when the market finished the full year lower, the Santa window often still produced gains. Since 1969, down years have still delivered a median Santa rally return of around 1.3%, despite broader annual declines.
In short, Santa doesn’t always arrive on schedule - but historically, he’s more reliable than not.
One asset to watch: Gold
While the Santa Claus rally is typically associated with equities, gold may deserve special attention this year. Rate cuts tend to weigh on real yields and soften the US dollar, both of which have historically supported gold prices. With monetary policy easing and inflation risks not yet fully mitigated, the broader macroeconomic environment appears increasingly supportive.
From a technical standpoint, gold has shown notable resilience. Prices have held above key medium-term support zones despite equity market volatility, suggesting that pullbacks continue to attract buyers rather than trigger sustained selling.
If risk sentiment improves heading into year-end, gold could advance in tandem with equities. If markets wobble, it may benefit from renewed defensive demand. Either scenario leaves gold well-positioned as a flexible macro play.
So is Wall Street getting a gift or the Grinch?
That is the question markets are grappling with.
The Santa Claus rally is not a forecasting tool, nor will it resolve concerns around growth, valuations, or market concentration. However, history suggests that ignoring it altogether has often proved costly.
With the Fed easing, liquidity thinning, and sentiment finely balanced, the odds still tilt towards some form of year-end move - even if it lacks staying power. Whether investors unwrap a gift or find a lump of coal, the Santa window is now open, and markets are paying close attention.
Expert outlook: Why gold may steal Santa’s spotlight
As equity investors debate whether Santa shows up, gold may not need the invitation. A combination of looser monetary policy, lower real yields, and persistent macroeconomic uncertainty creates an environment in which gold can perform regardless of the direction of equities.
Year-end liquidity conditions could further amplify price moves, particularly if US dollar volatility increases.
For traders, key factors to monitor include:
- Support levels near recent breakout zones
- RSI holding above neutral, indicating trend stability
- Directional moves in the US dollar during thin holiday trading
Gold does not depend on seasonal cheer - it tends to thrive when uncertainty remains elevated.
Key takeaway
The Santa Claus rally is a seasonal tendency, not a guarantee. This year, its outcome hinges on the balance between accommodative monetary policy and fragile investor confidence.
If equities rally, momentum could carry into early January. If not, assets such as gold may move into focus as investors turn more defensive. Either way, the end of 2025 looks set to reward careful positioning, selectivity, and disciplined risk management.
Gold technical analysis
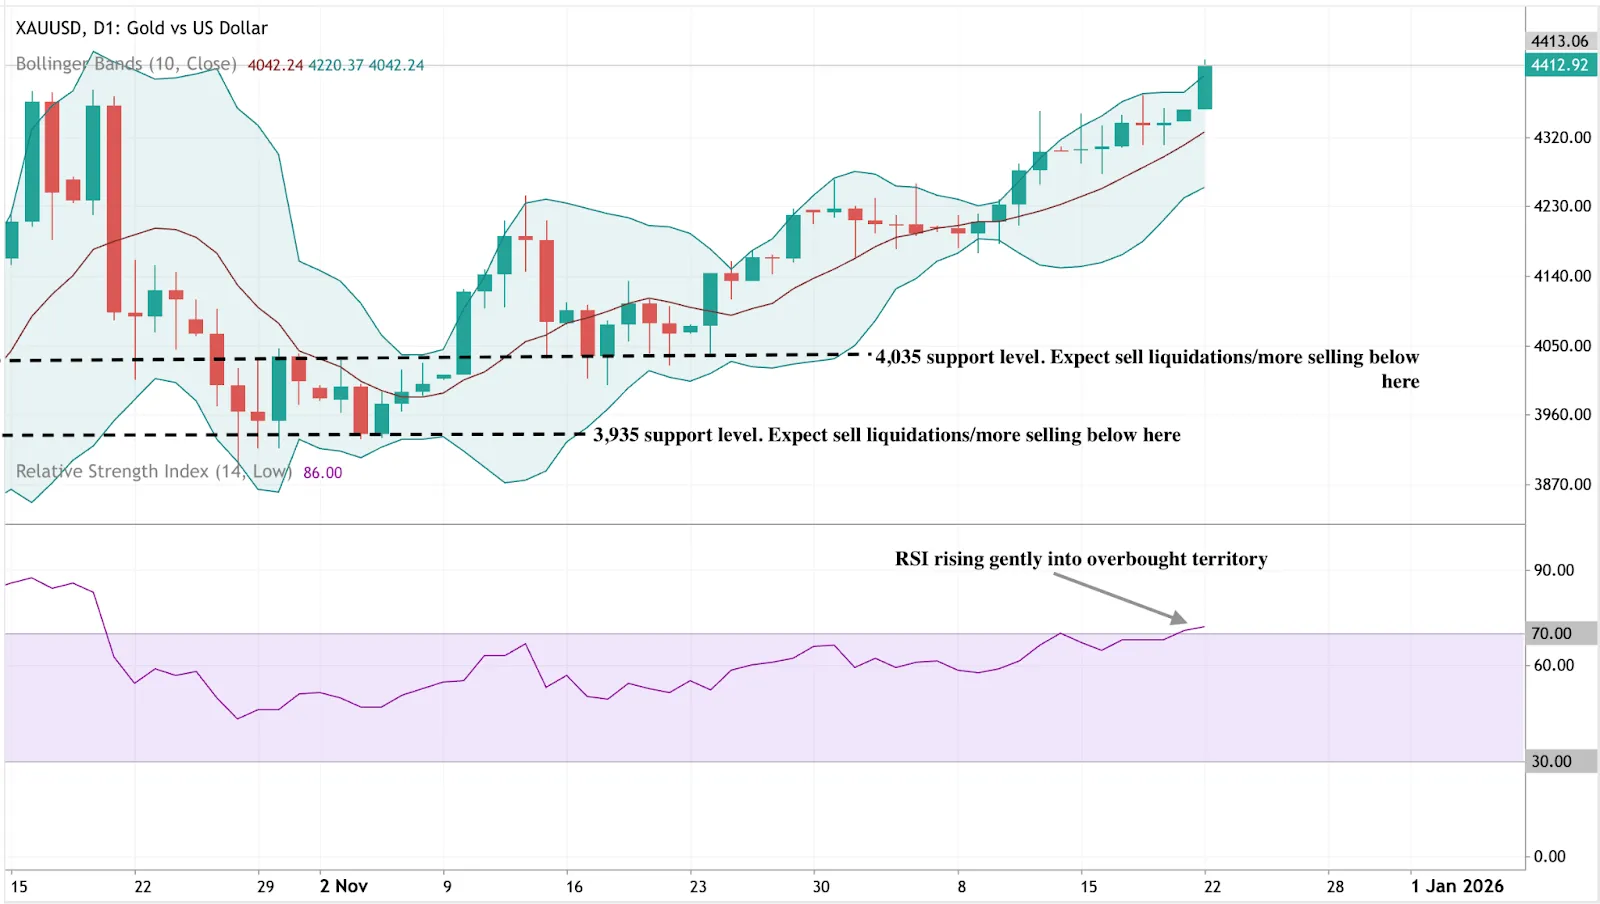
Gold continues to trade within a strong bullish trend, with prices hovering near the upper Bollinger Band. This reflects persistent upside momentum, while also signalling an increased likelihood of short-term consolidation.
On the downside, $4,035 represents initial support, followed by $3,935. A decisive break below these levels could trigger a deeper corrective phase. Momentum indicators remain elevated, with the RSI pushing into overbought territory, which is supportive of the trend but suggests that gains may pause without a pullback.
Disclaimer:
The performance figures quoted are not a guarantee of future performance.
FAQs
What is the Santa Claus rally?
How reliable is the Santa Claus rally?
Does the Santa Claus rally predict the year ahead?
Why does Federal Reserve policy matter for the Santa rally?
Why watch gold during the Santa Claus rally?
Can gold and stocks rise at the same time?


